








In 2025, trade in goods between Wales and the USA was worth £6.6bn, making the USA Wales’s largest single country trading partner, by value. This shouldn’t be confused with Wales largest trading partner overall, which is by far the EU. This profile explores the Wales-USA trading relationship. It explains:
- UK-USA Economic Prosperity Deal;
- How much Wales trades with the USA;
- What Wales trades with the USA;
- Which sectors are most reliant on Wales-US trade; and
- Wales-USA trade over 10 years.
Trade in goods is measured by value and/or volume. Trade in value is a measure of the monetary worth of goods traded, and can be influenced by price changes, exchange rates and inflation. Trade in volume captures the physical quantity of goods traded. As such, changes in trade value do not necessarily indicate a change in the quantity of goods traded.
The latest Wales-USA trade statistics are shown in Figure 2 and will be updated quarterly as new statistics become available. The remainder of the featured statistics will be updated annually to illustrate year-on-year trends.
This profile is part of our international trade series.
Only the UK Government can enter the UK into trade deals and does so on behalf of the four nations. It entered into an agreement with the USA in June 2025, following the USA’s introduction of reciprocal tariffs on a majority of its trading partners. The USA also introduced other tariffs which have impacted the UK, including on steel and aluminium.
The agreement, the Economic Prosperity Deal (EPD), is not legally binding. A number of its proposals have been introduced, such as a tariff quota for UK car parts, a reciprocal quota for beef, and access for UK pharmaceuticals. However, proposals around a favourable tariff for steel have not been introduced and the UK’s rate remains at 25%.
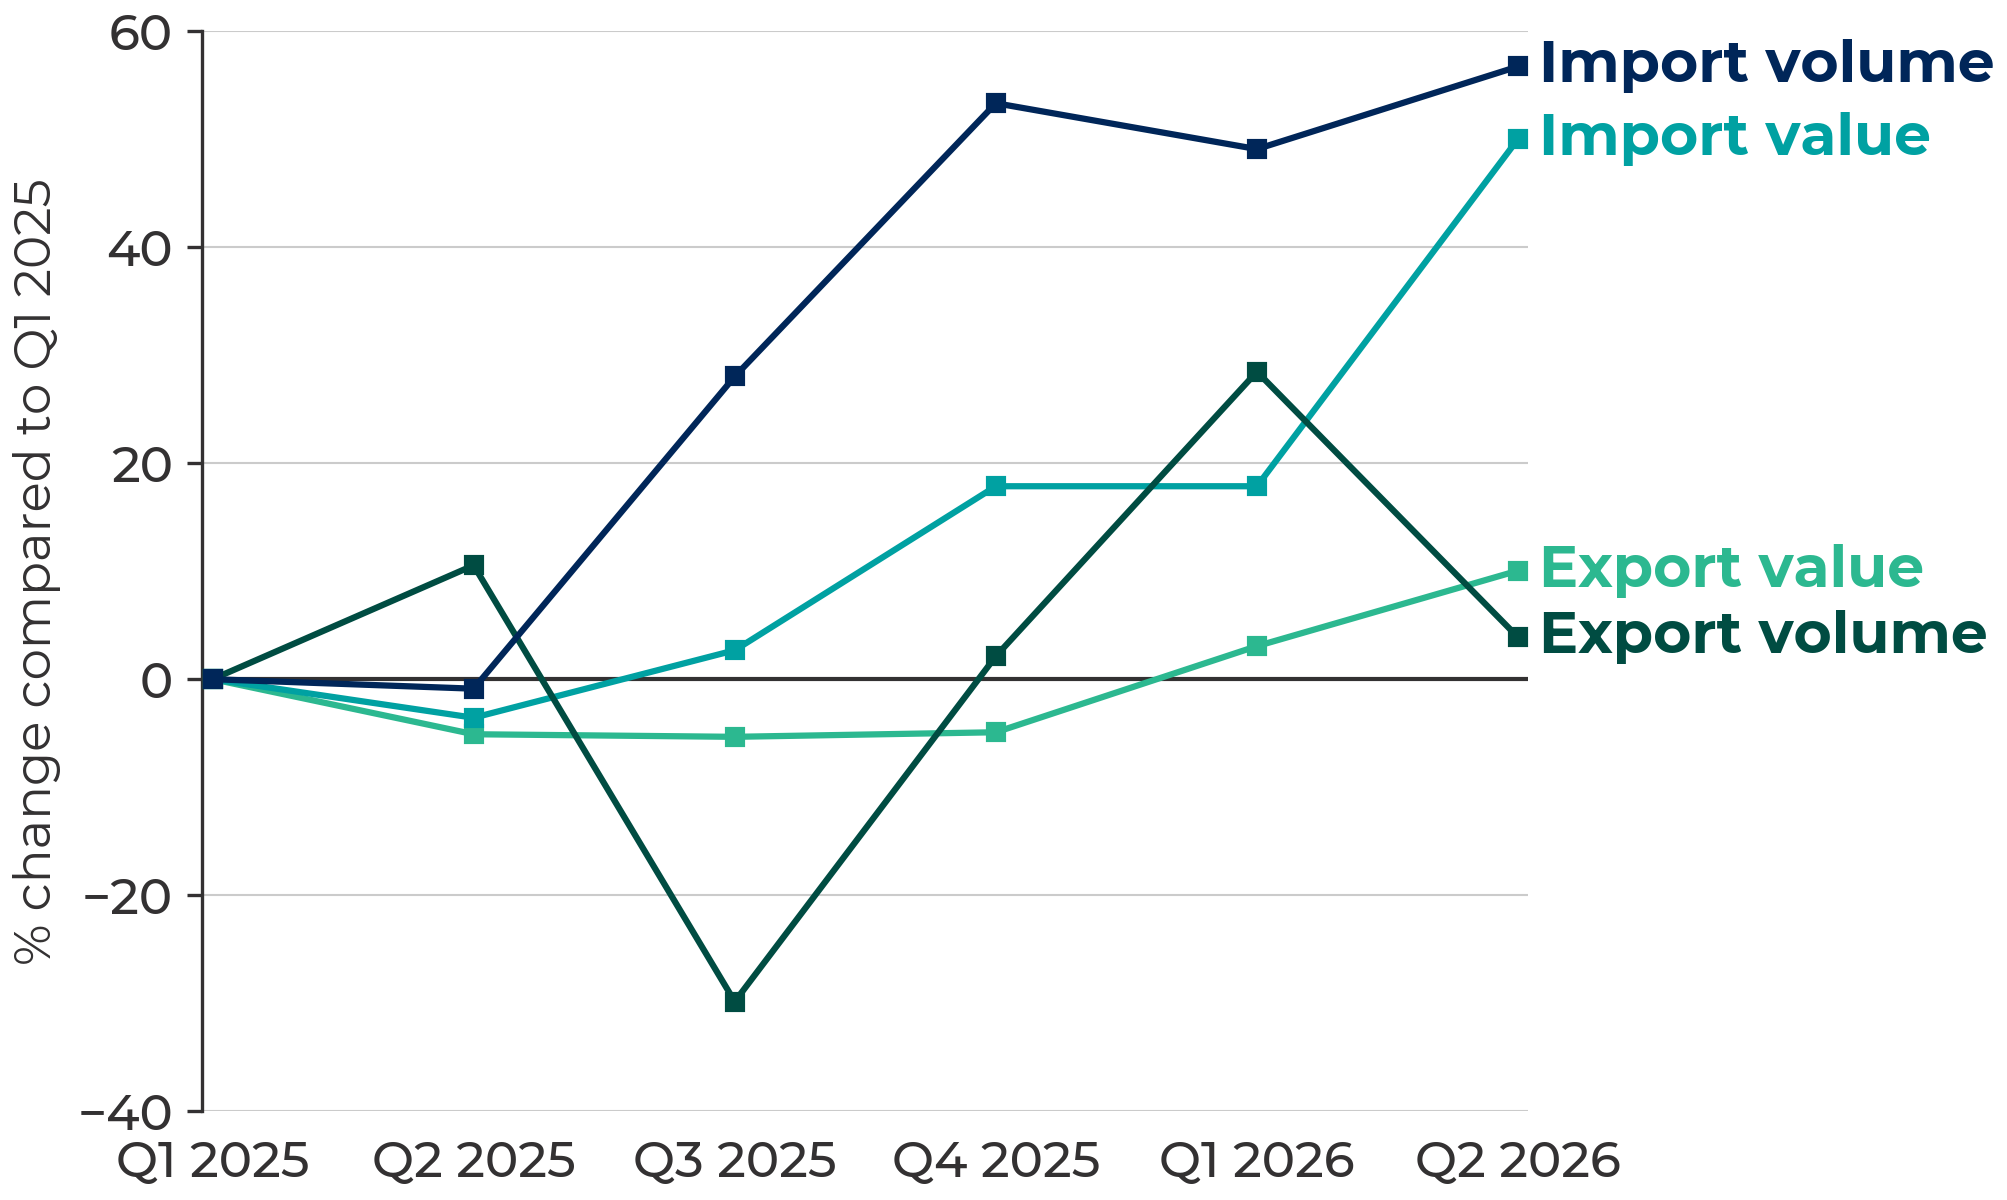
Figure 1 shows Welsh trade with the USA since the introduction of both tariffs and the EPD in quarter 2 2025. The value of exports has remained steady, but there was a dip in the volume of goods exported in Q3 2025. Over the same period, the value and volume of USA imports into Wales increased.
Figure 1: Welsh exports and imports to the USA since the introduction of tariffs and the Economic Prosperity Deal (By value and volume; up to Q2 2026)
Source: International goods trade: interactive dashboard (Welsh Government, 2026) (Figures may not add up due to rounding)
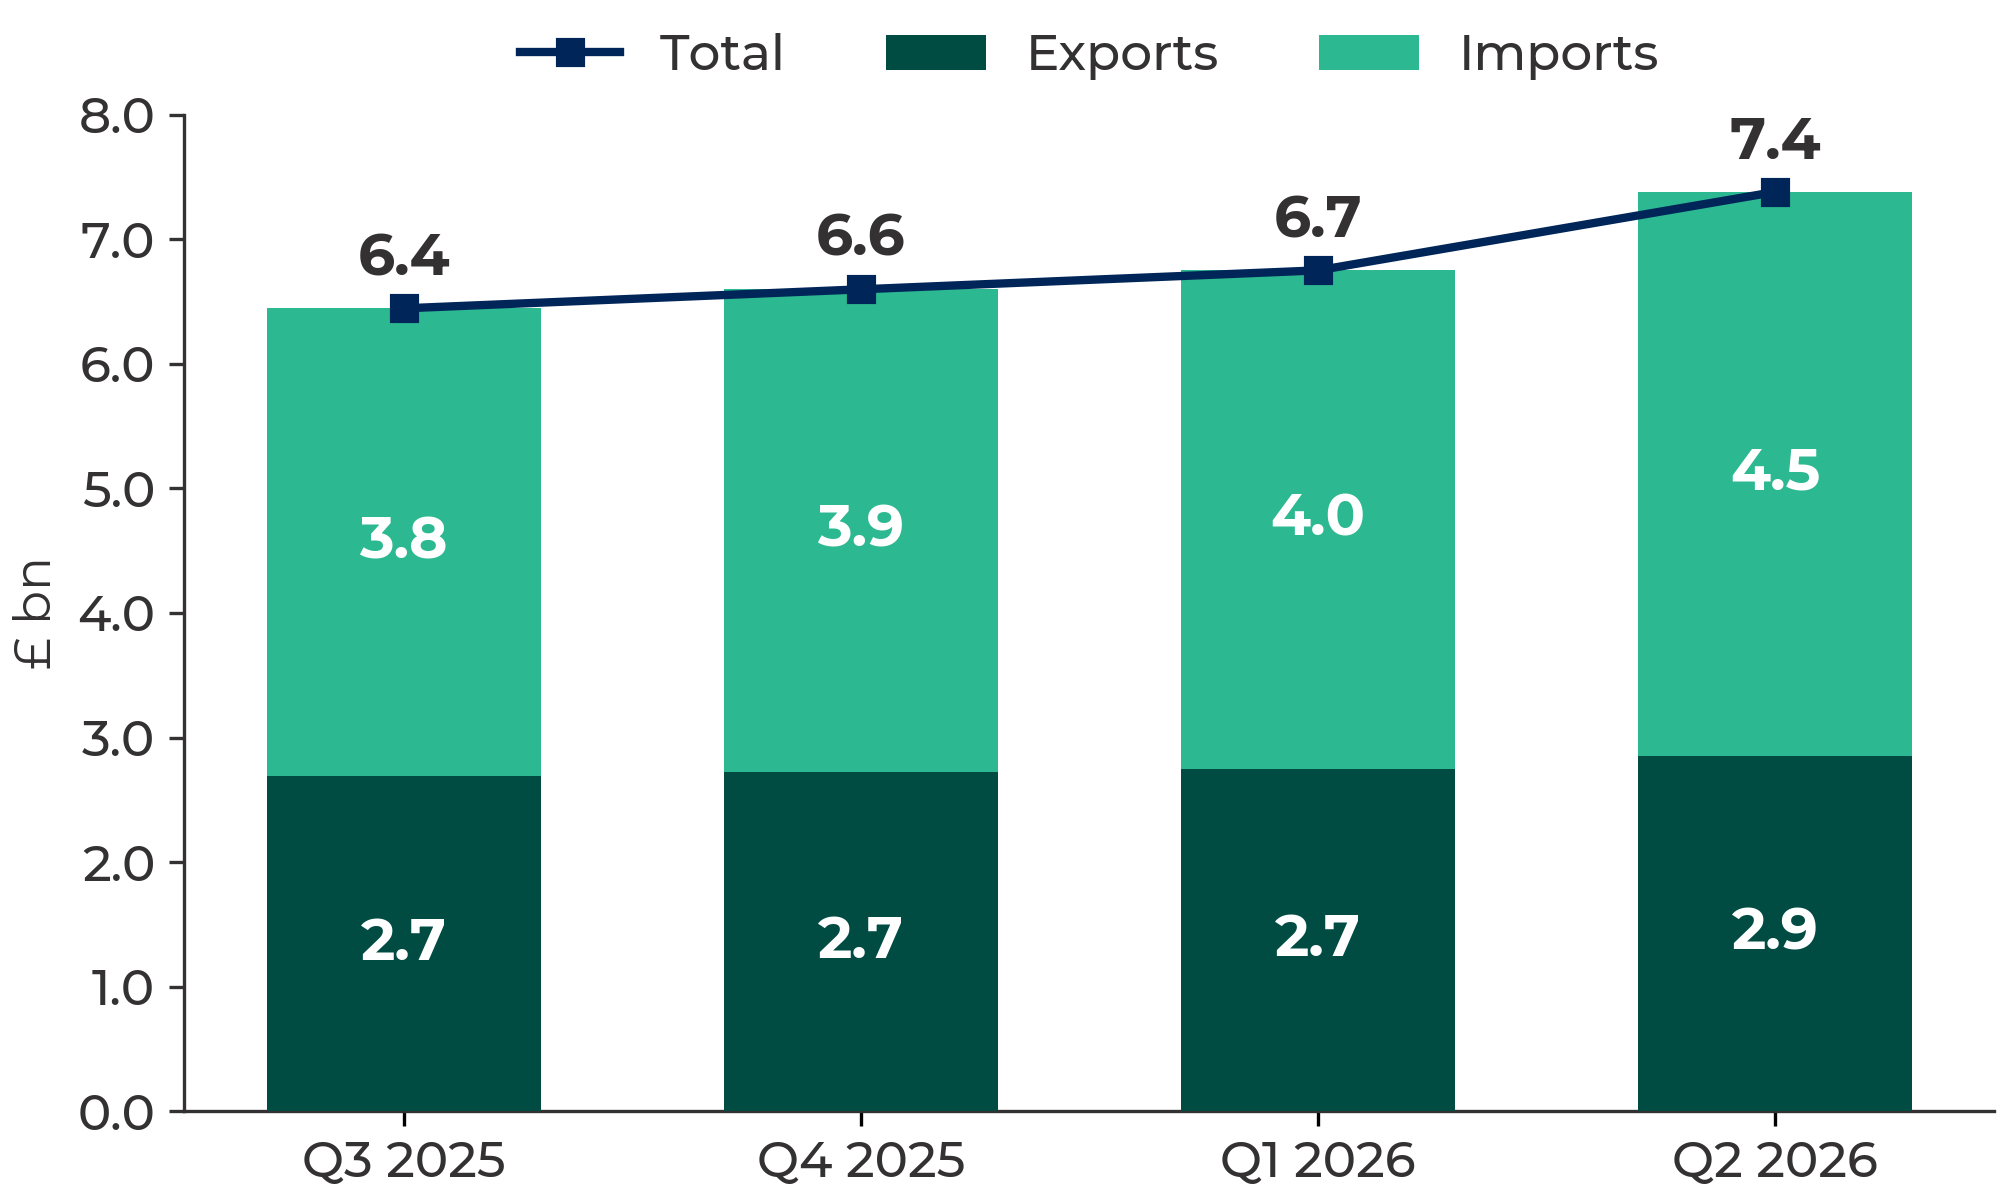
Figure 2 shows the current value of Wales-USA trade in goods, year ending Q2 2026. The preceding three quarters are also shown for comparison. Overall, Wales-USA trade has increased slightly over that time. This has been driven by import values as export values have remained steady.
Figure 2: Current value of Welsh trade in goods with the USA (by value; up to year ending Q2 2026)
Source: International goods trade: interactive dashboard (Welsh Government, 2026) (Figures may not add up due to rounding)
Figure 3 shows Wales’s top five single country trading partners for 2025 by value. The USA ranked first with a margin of £2.8bn between it and Germany in second place.
Figure 3: USA position in Wales’s top five single country trading partners (by value; 2025)

Source: International goods trade: interactive dashboard (Welsh Government, 2026)
Figures 4 and 5 present a breakdown of exported and imported products as a percentage of Wales-USA trade, by value and volume. They show that Wales’s trade with the USA is concentrated in a small number of product groups.
Figure 4: Exports by category of goods with the USA (by percentage of value and volume; 2025)
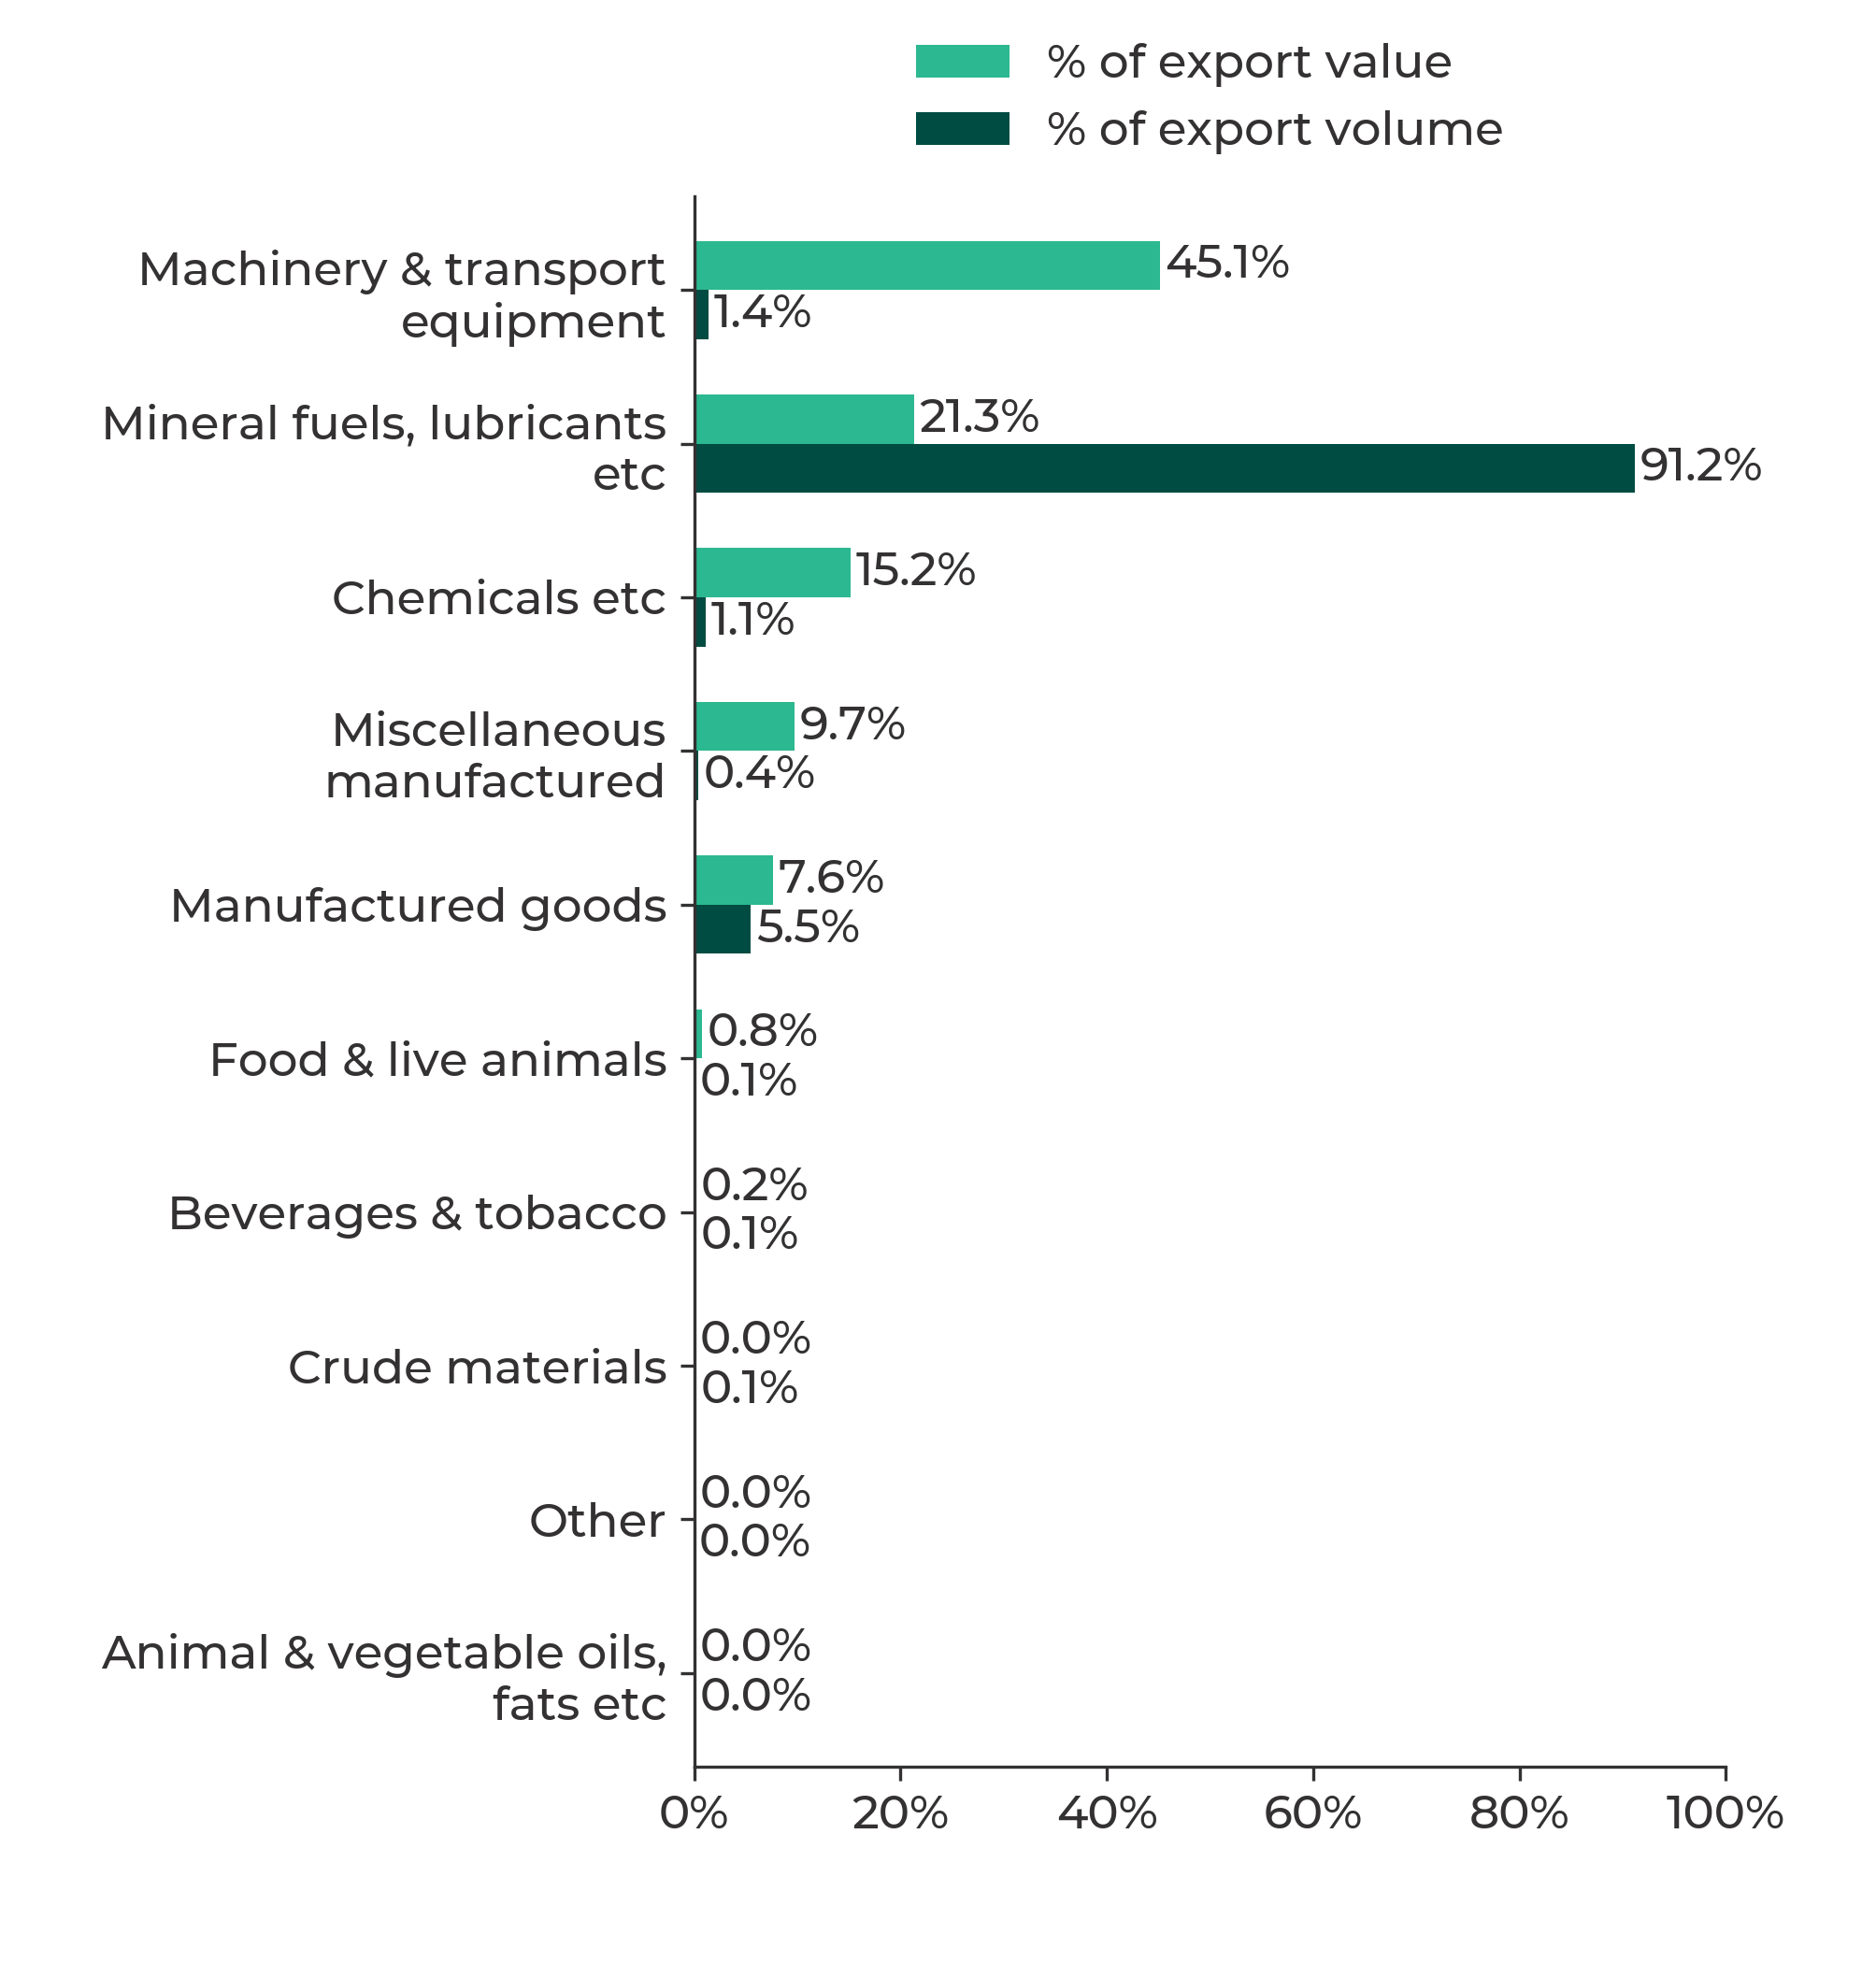
Source: International goods trade: interactive dashboard (Welsh Government, 2026) (Due to the small volume percentage for machinery and transport, it is not easily visible. The percentage stands at 1.4%.)
For both exports and imports, mineral fuels accounted for the greatest quantity of goods exported and imported, while representing a much smaller share of value. The charts show it is the inverse for machinery and transport, which make up a small percentage of volume but almost half of the value of Wales-USA trade.
Figure 5: Imports by category of goods (by percentage of value and volume; 2025)
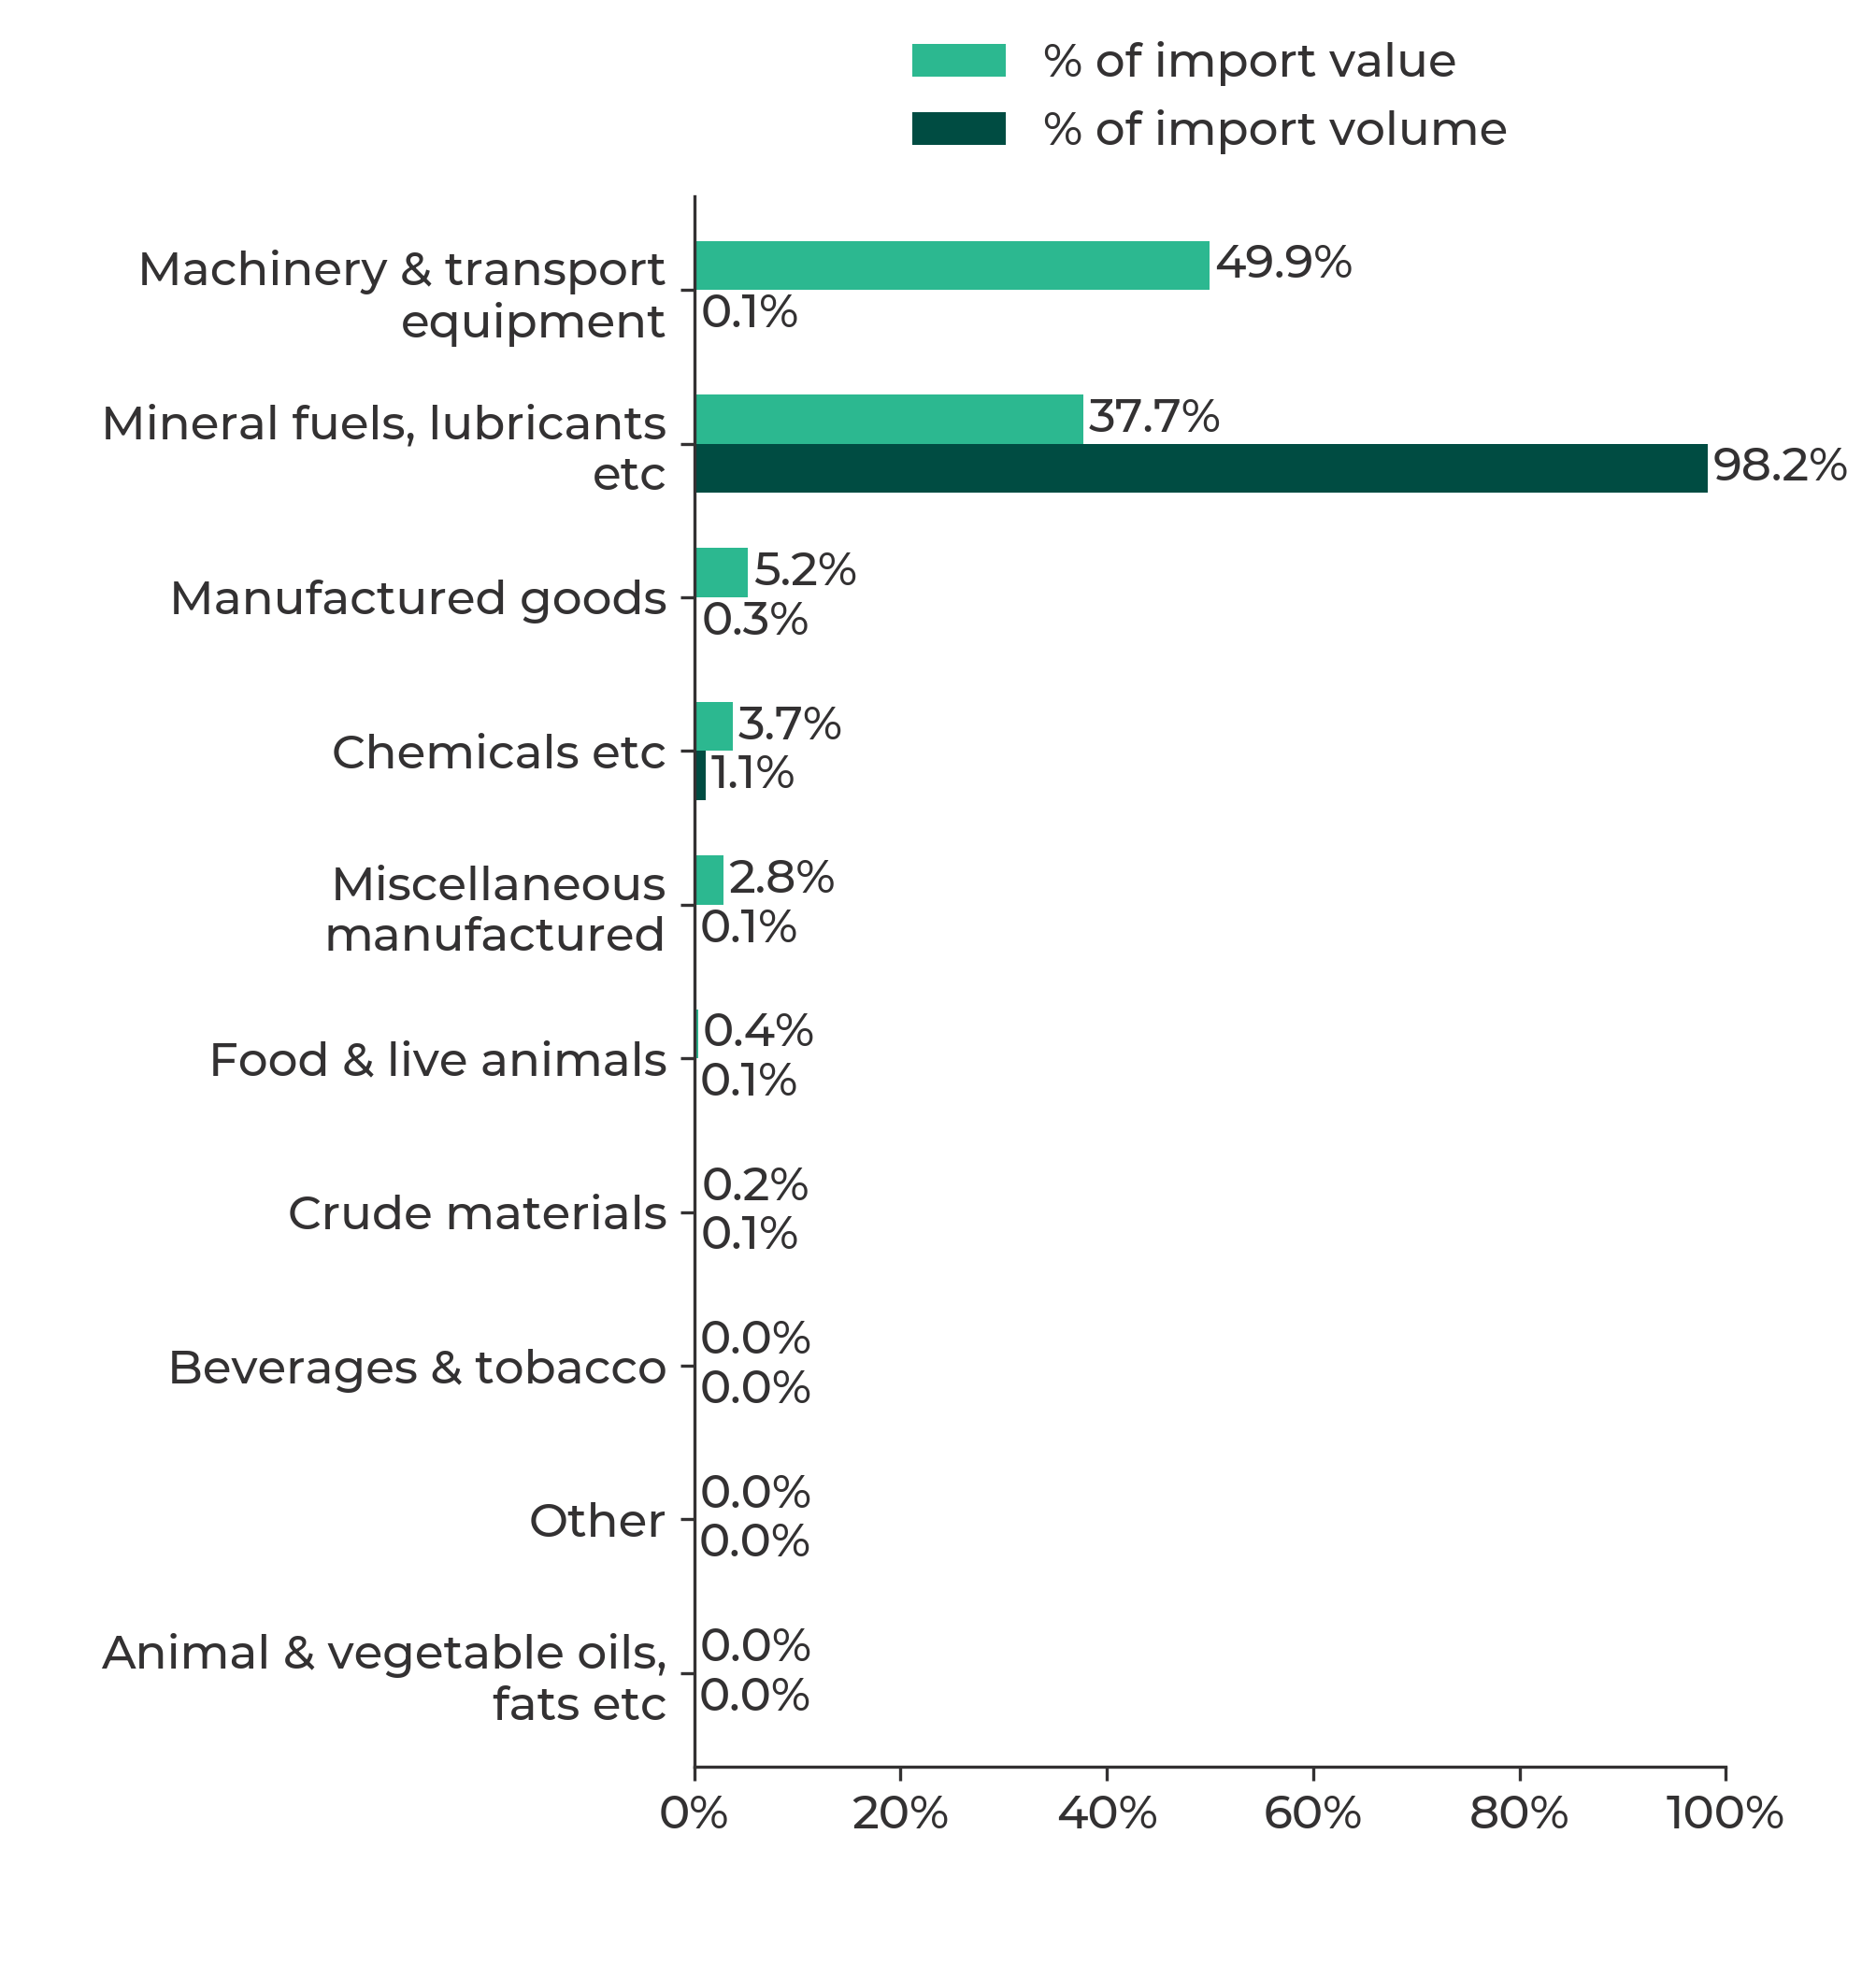
Source: International goods trade: interactive dashboard (Welsh Government, 2026) (Due to the small volume percentage for machinery and transport, it is not easily visible. The percentage stands at 0.1%.)
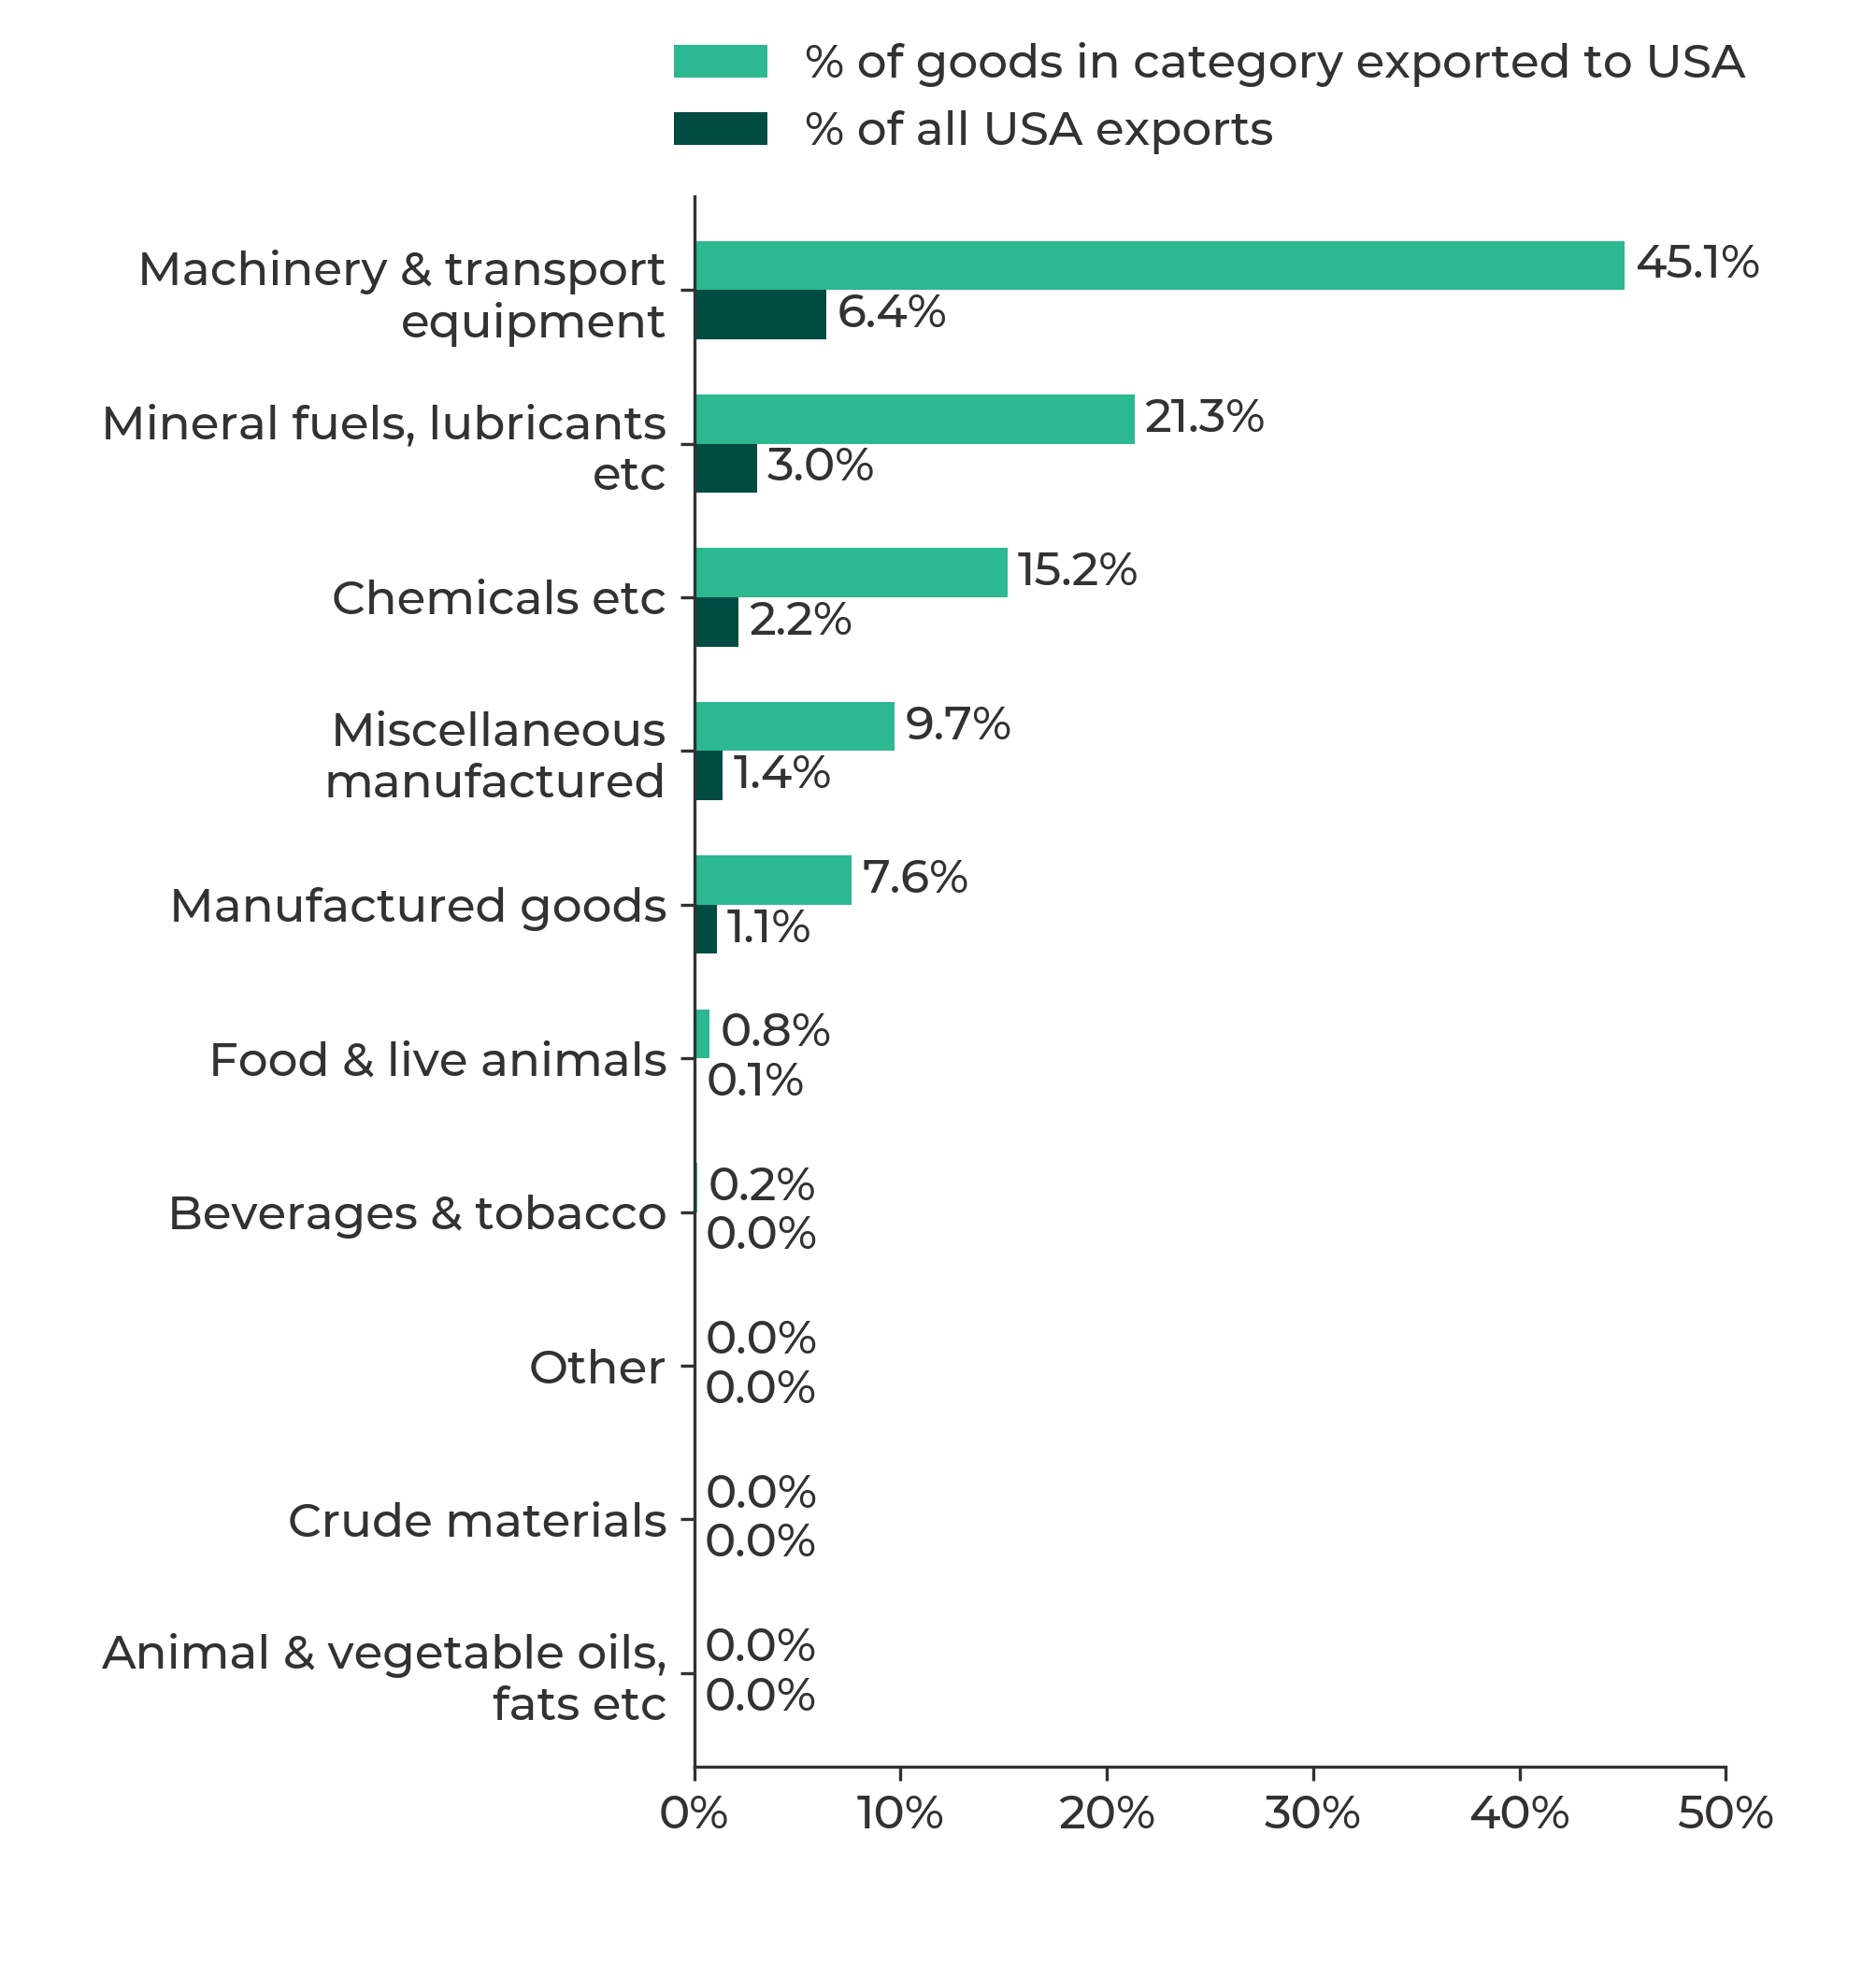
To understand how reliant a sector is on a particular market, it is useful to look at both the value of its exports to that market and how important that market is to a sector compared with others. Figure 6 shows the value of the USA market to sectors in Wales, and how important that sector is to Wales-USA trade overall.
As in the section above, it shows the value of Welsh exports to the USA is concentrated in a small number of sectors. Machinery and transport equipment accounts for the largest share of Welsh exports by value to the USA, at around 45%.
However, these sectors are less dependent on the USA when viewed against Wales’s overall exports of these products to other markets. For example, the USA accounts for only around 6% of Wales’s overall machinery and transport exports, 3% of mineral fuels exports and 2% of chemicals exports. This suggests that while these sectors are central to the Wales-USA trading relationship, they are not wholly reliant on the American market.
Figure 6: Sectoral reliance on exporting to the USA with contribution to overall USA exports (2025; by percentage of value)
Source: International goods trade: interactive dashboard (Welsh Government, 2026)
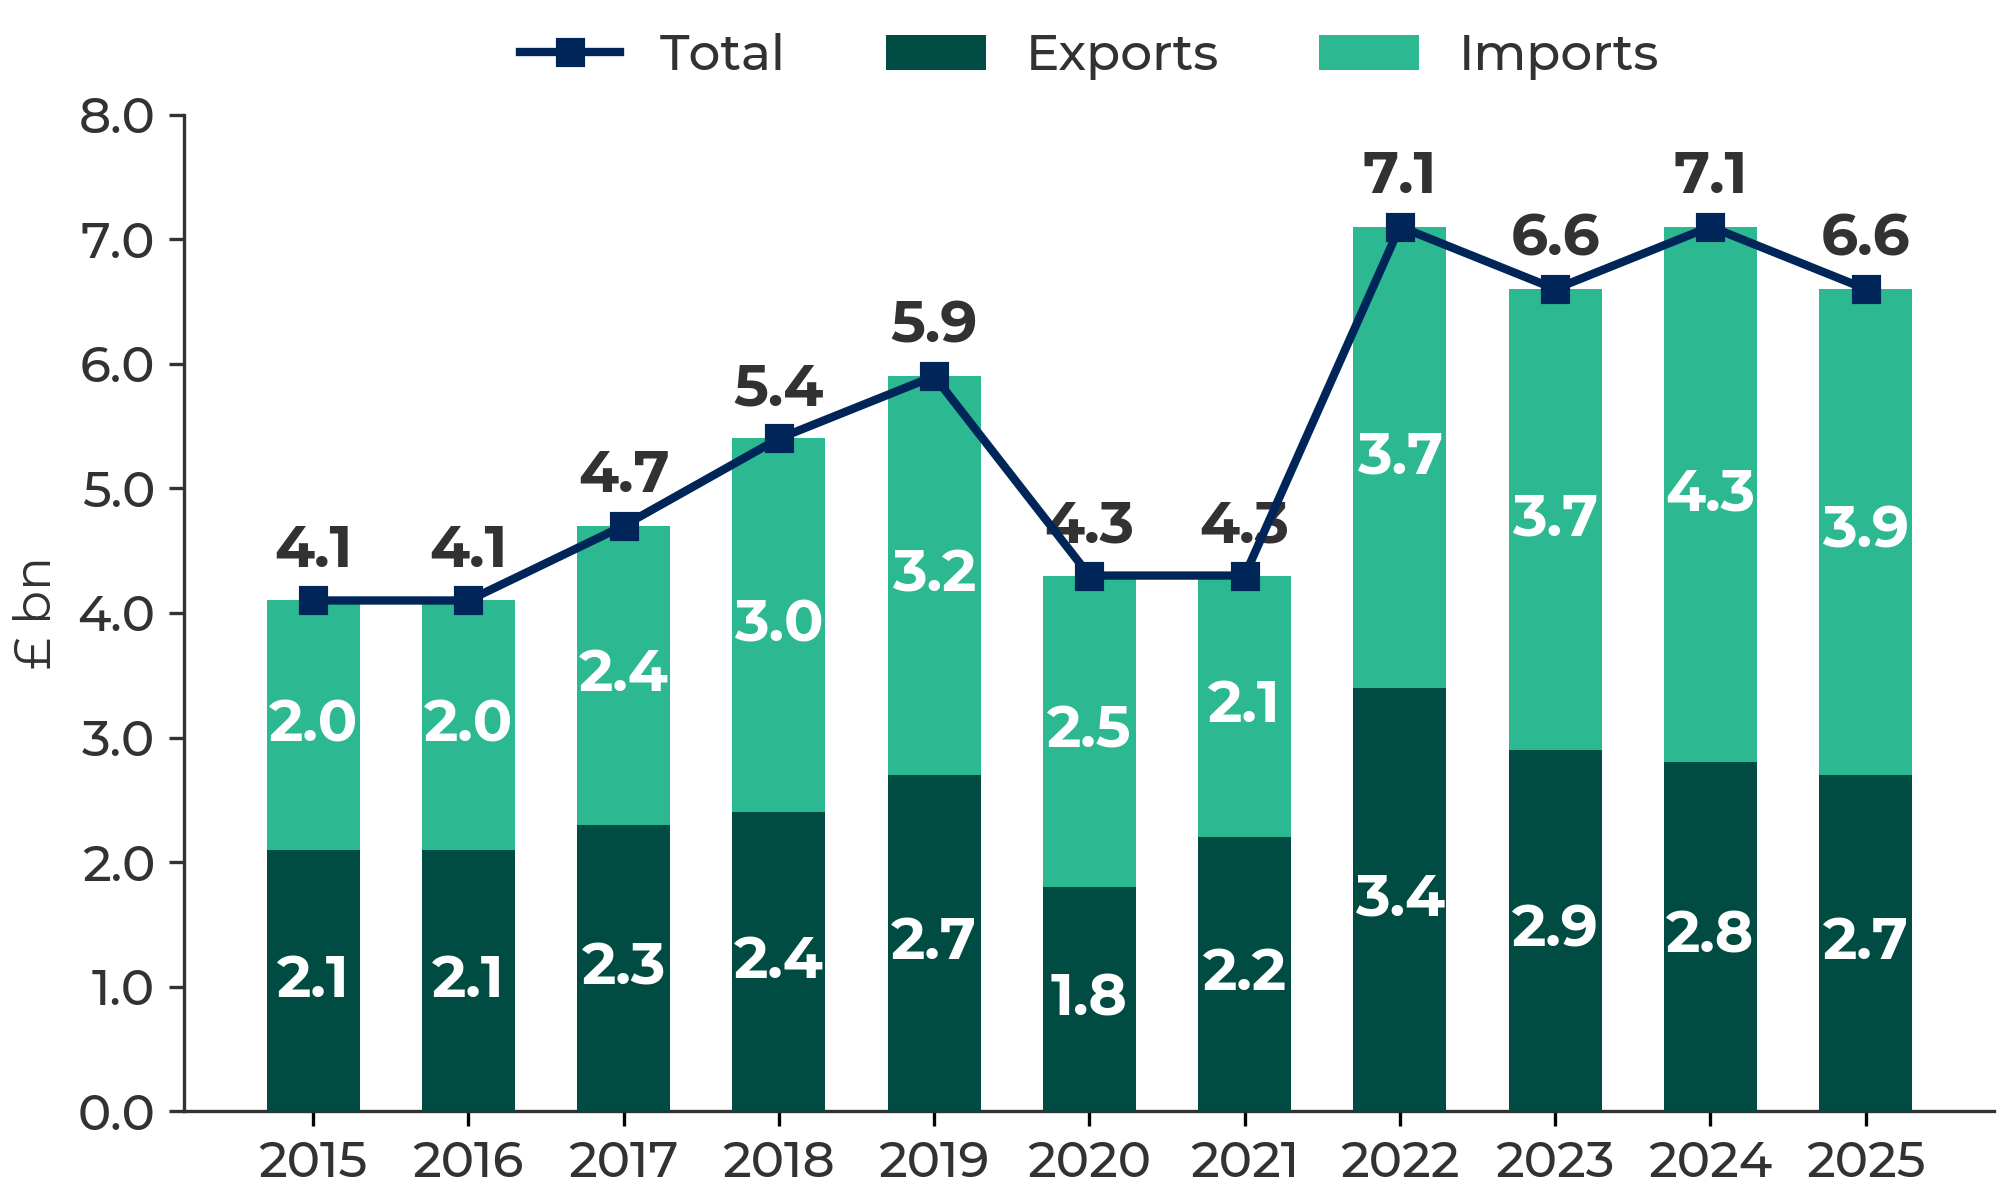
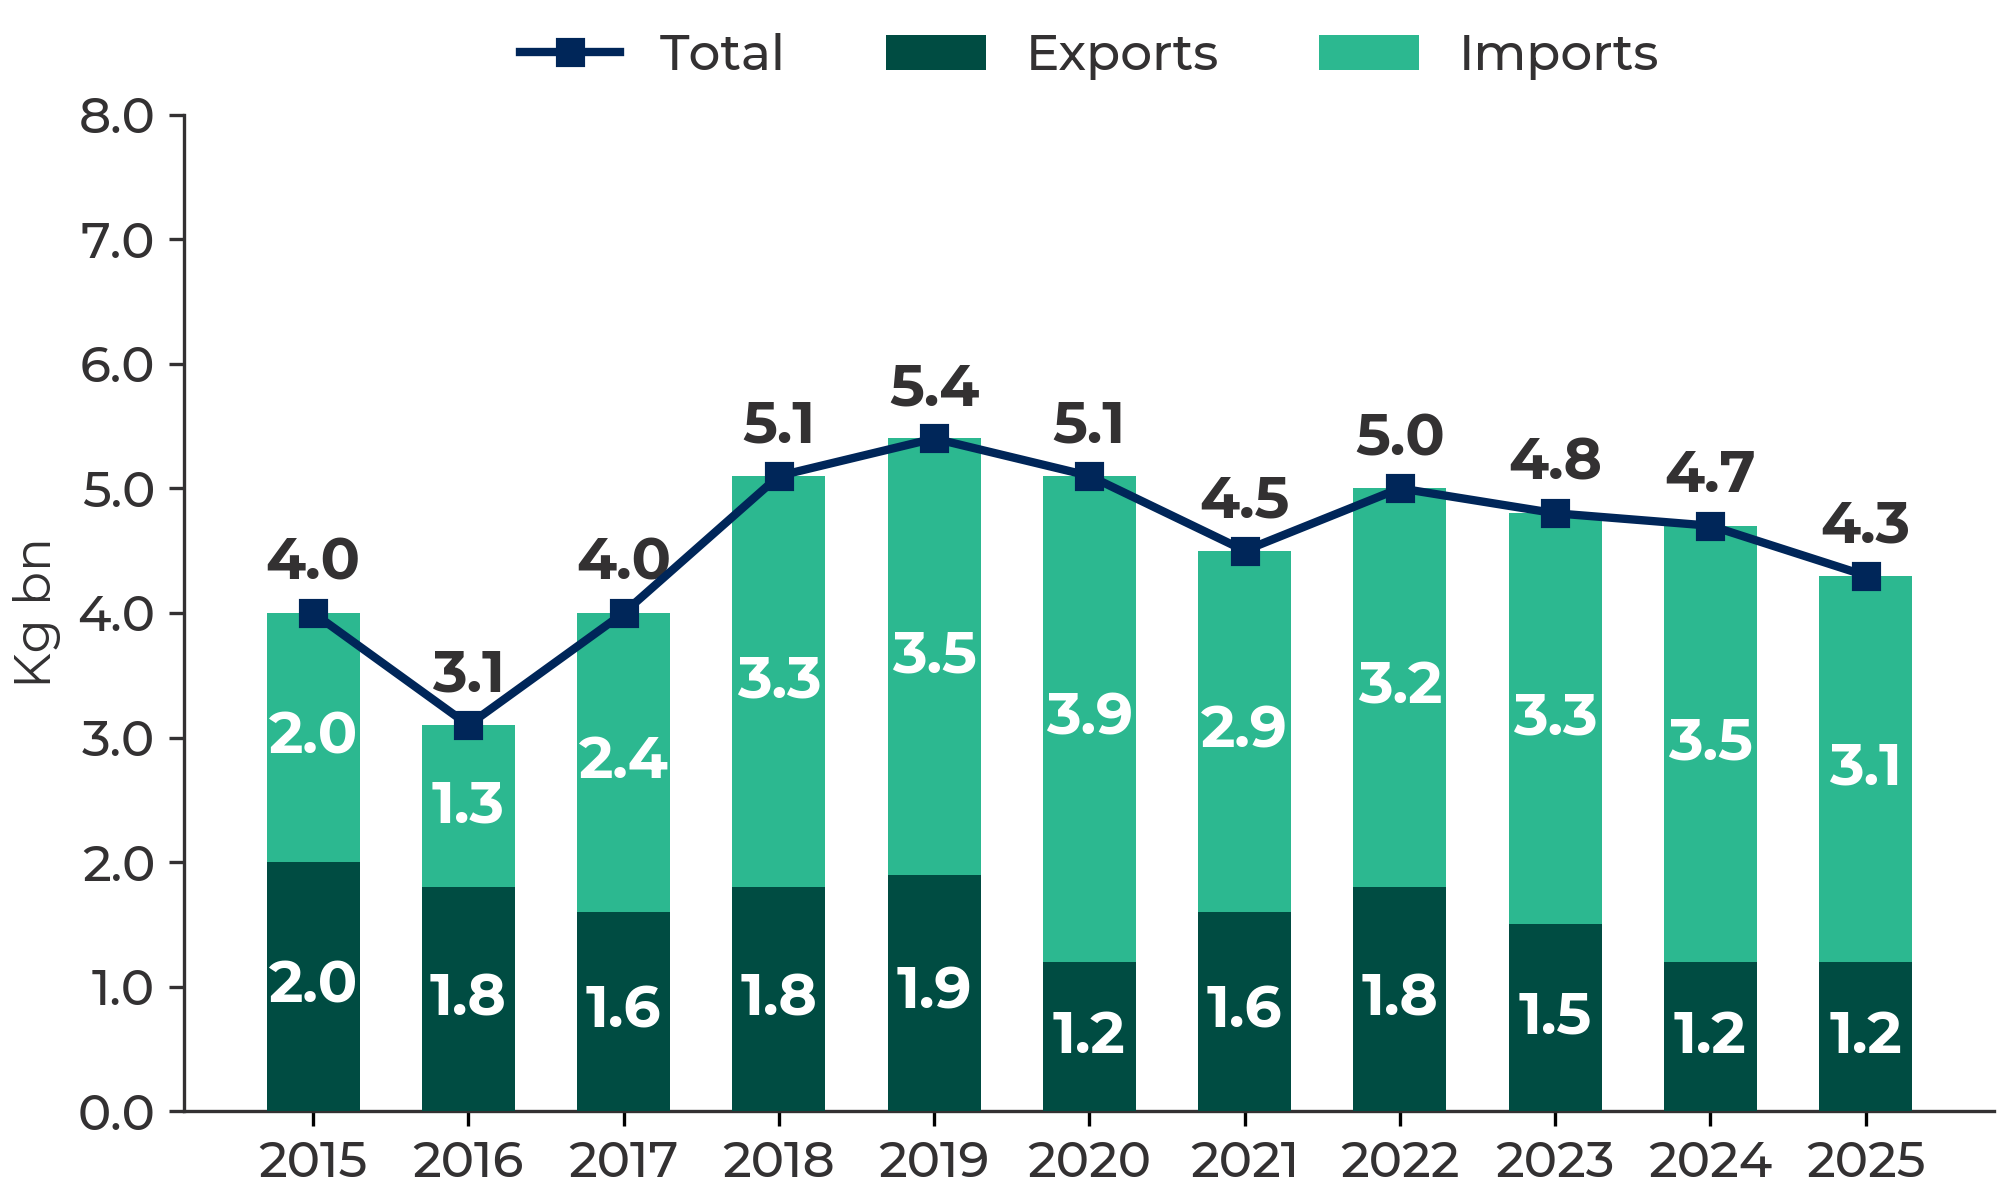
Figures 7 and 8 show the value and volume of trade in goods between Wales and the USA over a 10-year period.
Wales-USA trade has grown over time. There was a decrease in 2020 and 2021 but this falls in line with a broader dip in overall Welsh international trade (as shown in Figure 11 on our trade resource page).
Figure 7 shows Wales’s widening trade deficit with the USA. A trade deficit occurs when a country imports more than it exports. Import values increased from £2.0bn in 2015 to £3.9bn in 2025, while export values rose more modestly from £2.1bn to £2.7bn.
Figure 7: Trade in goods with the USA by value (2015-2025)
Source: International goods trade: interactive dashboard (Welsh Government, 2026)
While trade volumes have increased over the decade, they have not risen as sharply as trade values. This suggests that some of the increase in the value of Wales-USA trade may reflect factors such as higher prices or changes in goods traded, rather than a larger quantity of goods flowing between Wales and the USA.
Figure 8: Trade in goods with the USA by volume (2015-2025)
Source: International goods trade: interactive dashboard (Welsh Government, 2026)
Article by Maddy Phillips and Josh Jenkins, Senedd Research, Welsh Parliament