

In 2018 speed limits on sections of several major Welsh roads were reduced from 70 to 50 mph, aiming to improve roadside air quality. Eight years later, pollution levels are now below legal limits at all 50 mph sites, but other factors seem to have played a role. This article delves into the impact of speed limits and other possible influences.
Nitrogen dioxide and its health impacts
Nitrogen dioxide (NO2) is a toxic gas, exposure can exacerbate conditions like asthma, lung & heart diseases and increase inflammation of the lungs. Long-term NO2 exposure has been linked with reduced life expectancy.
Cars with combustion engines produce a variety of polluting gases, including NO2. Polluting emissions increase with vehicle speed, so lower speed limits can reduce NO2 concentrations in the air.
The Welsh Government has a legal duty to comply with pollution thresholds set by The Air Quality Standards Regulations 2010, including roadside NO2 limits:
- an average hourly limit of 200 micrograms per cubic metre (μg/m3), which cannot be exceeded more than 18 times in a calendar year; and
- an average annual limit value of 40 μg/m3.
Where and why were 50 mph limits introduced?
50 mph speed limits were introduced after the Welsh and UK governments were successfully taken to court over NO2 levels, which exceeded legal limits. 50 mph limits were introduced at five locations across the Welsh trunk road and motorway network, for which the Welsh Government is directly responsible:
- Wrexham: A483, junctions 5–6;
- Deeside: A494, St Davids Interchange to Deeside Park Interchange;
- Pontypridd: A470, between Upper Boat and A4058 roundabouts;
- Newport: M4, junction 25–26; and
- Port Talbot: M4, junctions 41–42.
Roadside pollution levels are monitored in these locations, and limits have been enforced with speed cameras since October 2021 (November 2022 at Newport).
Figure 1: 50 mph limit locations on motorways and trunk roads
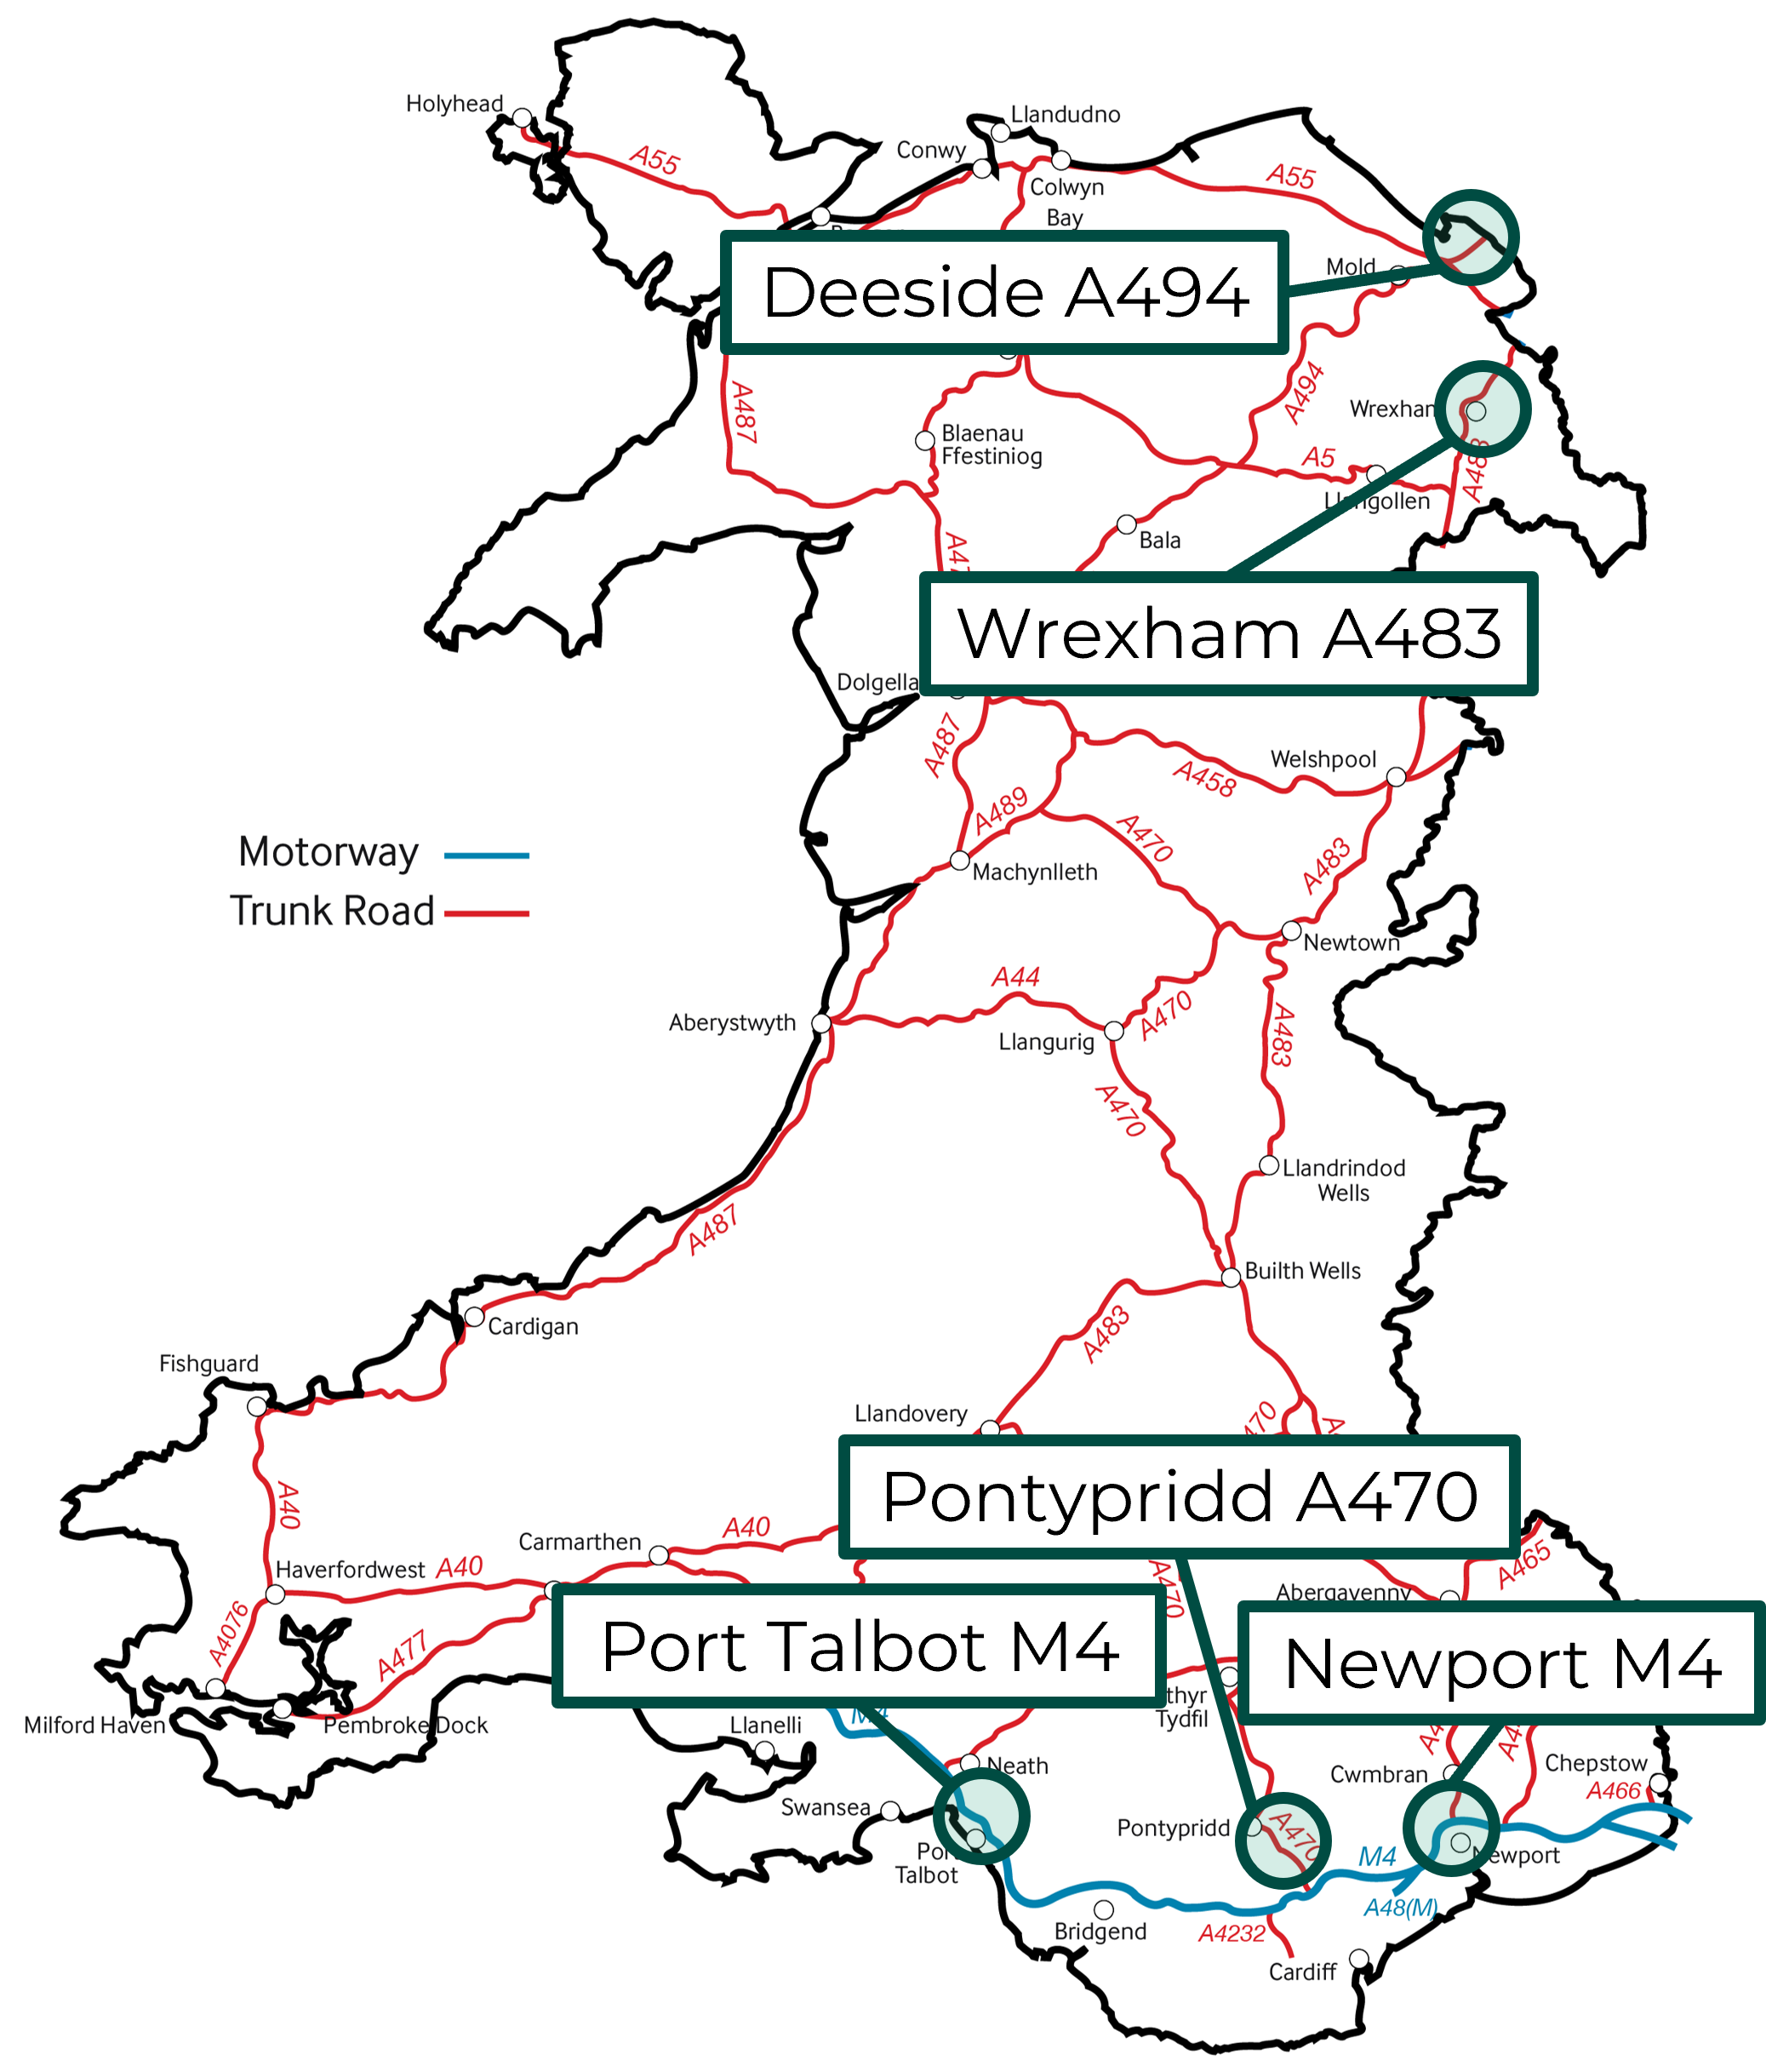
Source: Senedd Research
50 mph limits have been contentious. Since their introduction, the Senedd has accepted three petitions opposing the limits, which cite infringements on freedom and economic impacts.
Table 1: List of accepted Senedd petitions related to 50 mph speed limits
|
Title |
Date completed |
Number of signatures |
|
Return all the M4 to the 70mph speed limit, in Wales. Remove all lower speed limits forced on us. |
11 February 2026 |
3,334 |
|
Scrap the 50mph limits on the M4 around Newport and Swansea and on the A470 around Pontypridd |
13 May 2024 |
1,136 |
|
Remove the average speed cameras and 50mph speed limit on the M4 between Newport and Cardiff |
15 November 2021 |
145 |
Members have raised concerns about enforcement cost. Responding to a written question in November 2022, the then-Deputy Minister for Climate Change said speed camera implementation had cost £3.34 million.
How has air quality changed since 50 mph was introduced?
The Welsh Government publishes annual NO2 monitoring data for each of the 50 mph sites. The box below describes how we’ve analysed this data. Note that road vehicles also emit other harmful pollutants, but this analysis focusses solely on NO2.
Each 50 mph site is monitored using multiple diffusion tubes. The data publications provides average annual NO2 for each monitoring station within a 50 mph site. In this article, we calculate an ‘average’ annual NO2 for the whole site by combining multiple roadside locations. Discontinuous and newer monitoring locations are therefore excluded from this average calculation. For example, for the A470 at Pontypridd there were 10 roadside monitoring stations in the 2024 data, but we calculate averages only using the 6 sites that have been continuously operational since 2018. ‘Background’ monitoring sites are located in nearby urban locations away from the roadside, enabling comparisons with roadside trends.
‘Excess’ air quality improvement at a site, shown in Table 2, reflects how much roadside air quality has improved more than background levels. It is calculated by subtracting background improvement (% change) from roadside improvement (% change). For example, if roadside NO2 concentration dropped by 10%, while background NO2 fell by 6%, the ‘excess’ improvement would be 4%.
The Welsh Government publication includes annual traffic counts for each site, taken from Department for Transport statistics. In some cases there are multiple ‘count points’ distributed either side of junctions. For calculating percentage change in traffic, we added total traffic for all count locations within a site.
Average roadside NO2 fell by 42–63% between 2018 and 2024, and pollution was below the legal threshold for all sites in 2021, 2023, and 2024. At Deeside, Wrexham, and Port Talbot, NO2 has been below the legal threshold for every year since 2020.
Figure 2: Average annual roadside NO2 trends since 2018
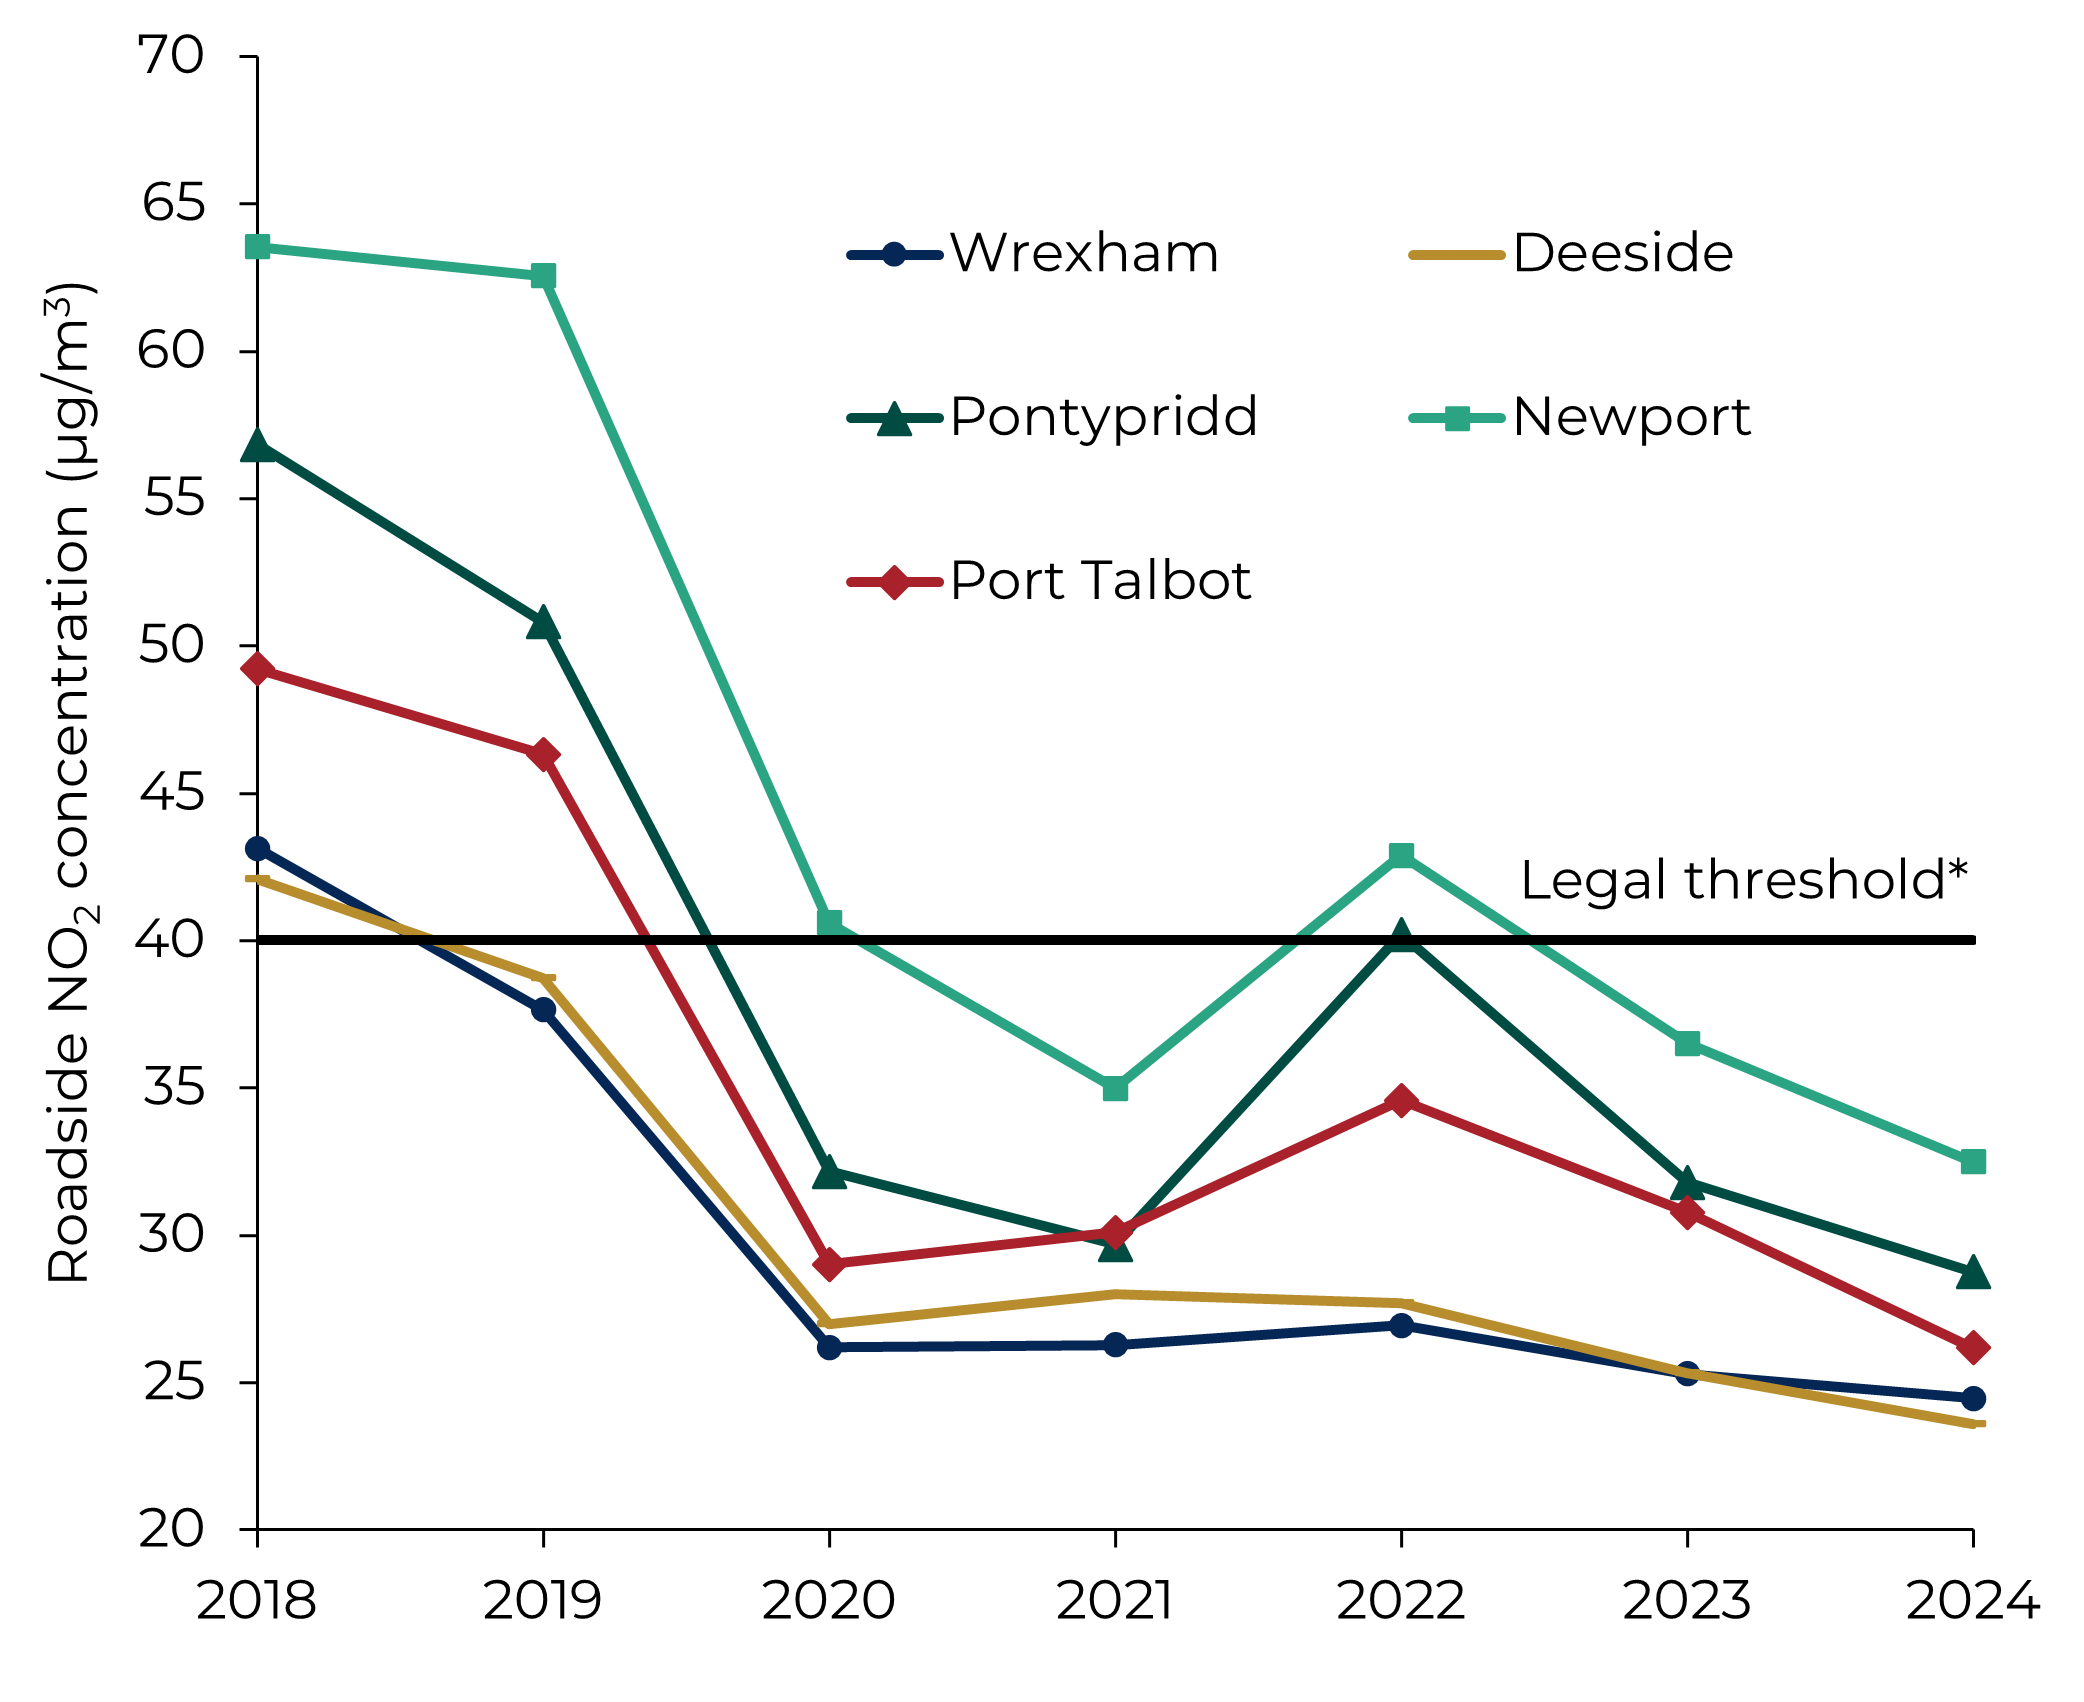
Source: Senedd Research analysis of Welsh Government data
*Threshold is indicative only, see The Air Quality Standards Regulations 2010 for precise legal definitions
Pollution fell dramatically in 2020, coincident with the Covid-19 pandemic and associated travel restrictions. Pollution levels rebounded at Pontypridd, Newport, and Port Talbot in 2022, but have since gradually fallen. Wrexham and Deeside saw no major post-pandemic NO2 rebound, and improved further in 2023 and 2024.
Background (i.e. non-roadside) NO2 fell by 32–41% between 2018 and 2024, implying a broader trend towards improved air quality.
Is there just less traffic now?
There was 1–6% less traffic in 2024 than in 2018 for all sites, but vehicle numbers had mostly recovered from lows in 2020 and 2021.
Pollution has proportionally fallen more than traffic (Figure 3). For example, traffic on the M4 in Newport was 1.5% lower in 2024 than 2018, while pollution fell by 63%. Average NO2 pollution per vehicle has therefore fallen.
Figure 3: Proportional change in average traffic and NO2 levels, 2018–2024
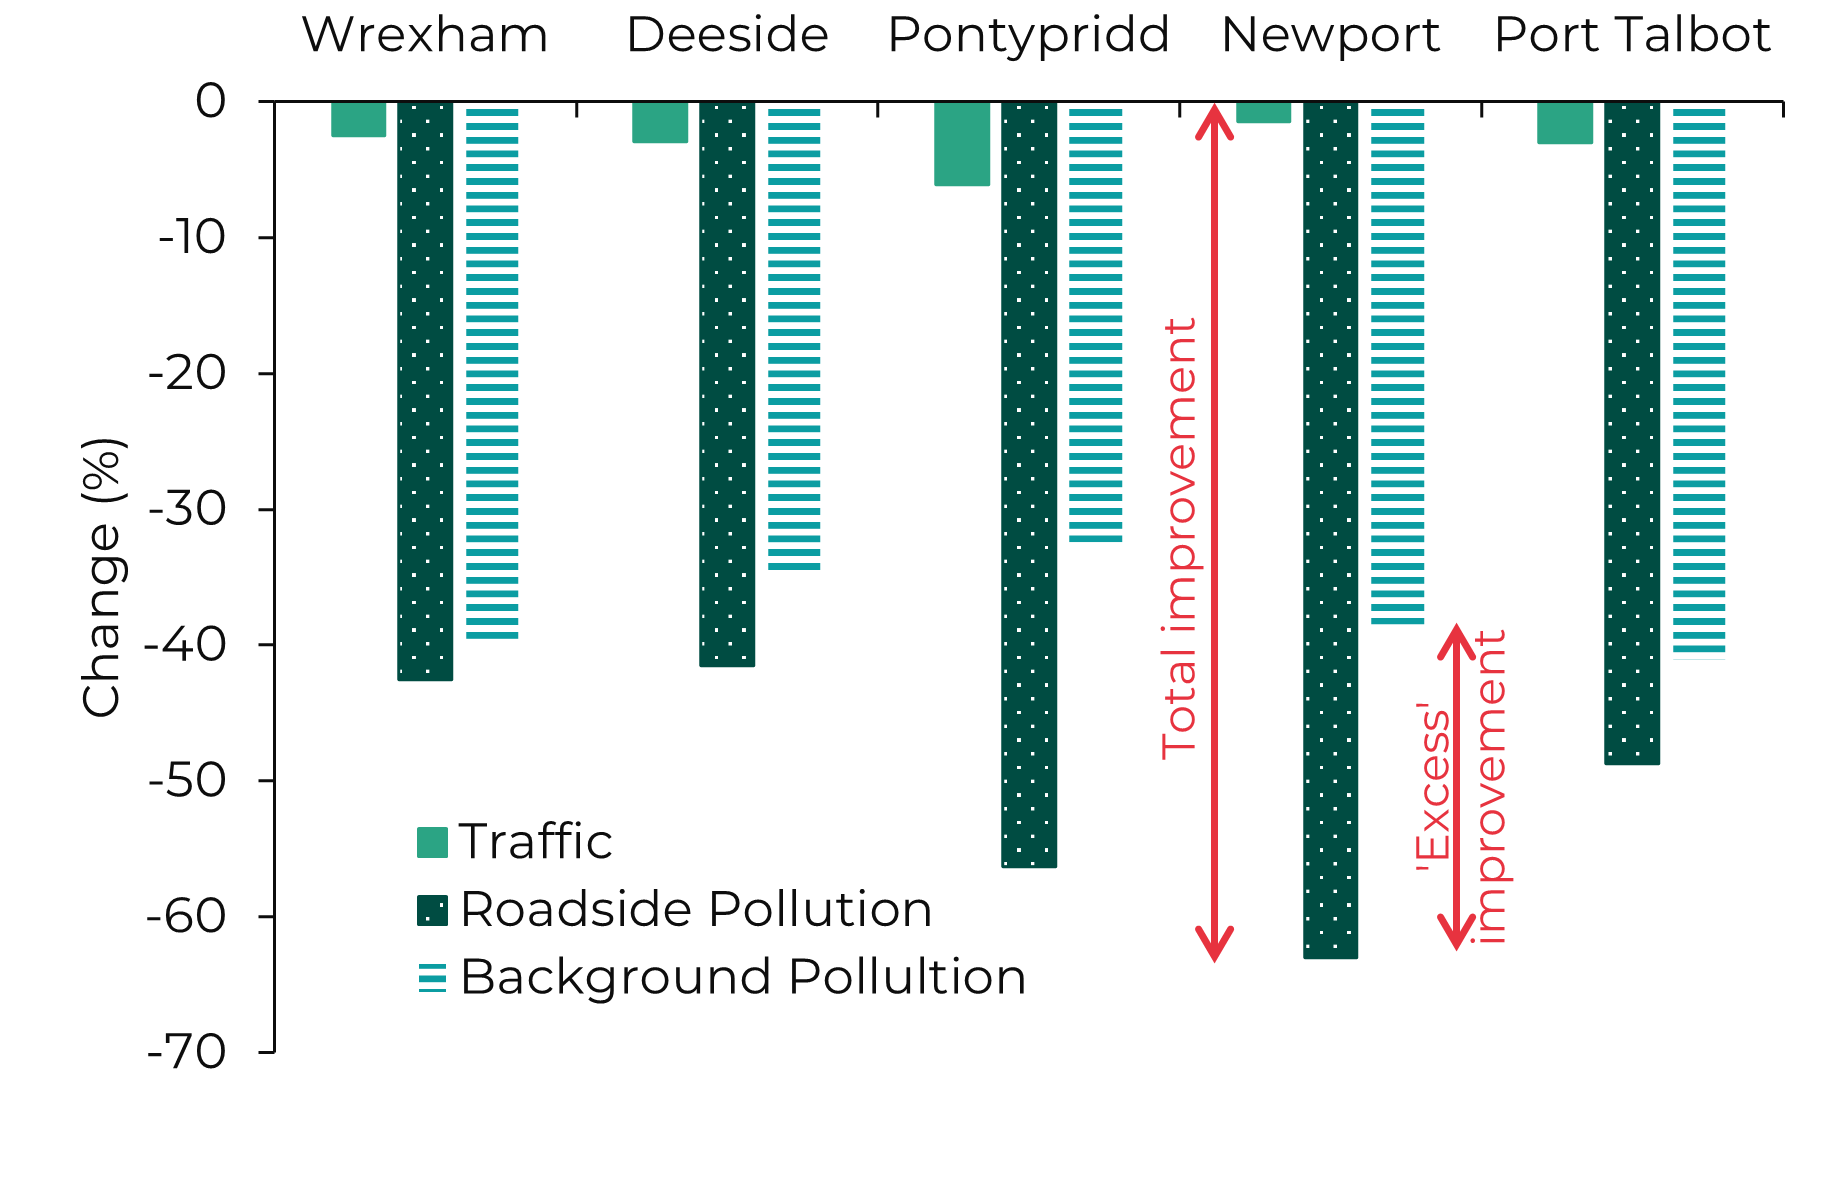
Source: Senedd Research analysis of Welsh Government data
What role have 50 mph limits played in the improvement?
Although roadside air quality has improved considerably, it’s unclear whether speed limits drove these changes, given major improvements to background air quality.
All 50 mph sites experienced an ‘excess’ air quality improvement beyond background levels. A higher ‘excess’ improvement could imply that 50 mph limits have been more effective at reducing air pollution, although other local factors (such as vehicle types and fuels efficiencies on major roads) cannot be ruled out. ‘Excess’ improvement gives an upper estimate of the possible impact of 50 mph speed limits.
The biggest ‘excess’ improvements occurred at Pontypridd and Newport, with lower values at Deeside and Port Talbot. Wrexham’s roadside air quality improved only slightly more than background levels.
Table 2: ‘Excess’ improvements in roadside NO2 above background level by site
|
Location |
‘Excess’ roadside improvement |
|
Wrexham (A483) |
2.8% |
|
Deeside (A494) |
7.0% |
|
Pontypridd (A470) |
23.9% |
|
Newport (M4) |
24.6% |
|
Port Talbot (M4) |
7.6% |
Source: Senedd Research analysis of Welsh Government data
Other reasons for air quality improvements
Wales has seen a long-term improvement in national air quality. Emissions of nitrogen oxides fell by 63% between 2005 and 2023, with sharp falls from energy and manufacturing industries.
Transport’s emissions more than halved over the same time, although transport remains the biggest single source of nitrogen oxides. A range of social, technological and policy developments help explain these changes. Improved vehicle efficiency, partly driven by the European Union’s ‘Euro emission standards’, has reduced pollution from petrol and diesel engines, with even stricter standards expected from 2026. The UK also follows these standards.
At the same time, the uptake of electric vehicles (EVs) has accelerated: EVs and hybrids accounted for almost half of new UK registrations in 2025, rising from just 7% in 2018, and there are now 2.8 million EVs on UK roads. By 2035 all new cars will need to be fully electric, although older petrol and diesel vehicles will remain in use for some time due to long vehicle lifespans.
Changes in travel behaviour may have also influenced pollution levels. In 2021, the previous Welsh Government set a target for 30% of the workforce to work remotely ‘on a regular basis’. Across the UK, 42% of employees worked either fully or partly from home in early 2025. Home working may have played a role in reducing pollution in 2020 and 2021, but as noted in the earlier analysis, there was only a small reduction in total traffic on those five roads between 2018 and 2024.
The previous Welsh Government also promoted active travel and public transport, investing £218 million in active travel between 2013 and 2024 and setting a target for 45% of journeys to be made by sustainable modes by 2040. However, public transport use remains similar to pre-pandemic levels. Total bus journeys were 22% lower in 2024-2025 compared to, 2019-20 while rail use rose only slightly, from 31 million trips in 2018 to 31.7 million in 2025. Public transport use is therefore unlikely to have contributed significantly to air quality improvements.
Future prospects for 50 mph limits
The previous Welsh Government said 50 mph speed limits were a demonstration of its “commitment to put the environment at the heart of everything it does”, while acknowledging “…slower speed limits are not a popular choice”.
Since introducing 50 mph limits, the last Welsh Government maintained that limits would “...be reviewed periodically”. In January 2025 the then-Cabinet Secretary for Transport and North Wales was asked about M4 traffic ‘bottlenecks’at Port Talbot, saying:
We are hopeful that the [50 mph] measure will be successful, and, of course, if levels of pollution can drop along those routes below the legal threshold, then we'd look at removing those speed restrictions.
Article by Charlotte Morgan and Dr Matthew Sutton, Senedd Research, Welsh Parliament
Senedd Research acknowledges the parliamentary fellowship provided to Charlotte Morgan by the Engineering and Physical Sciences Research Council (EPSRC) which enabled this article to be completed.