The current condition of Welsh bus services has been raised as a concern by members of the travelling public, as well as representatives of the bus industry.
This article is the first of a two part series looking at bus services. In it we consider the challenges facing the industry in Wales and explore what’s behind performance issues. The second article details the proposed bus reforms.
Bus passengers and occupancy have decreased
The number of bus passenger journeys has been in decline in Britain (outside London) over the last two decades. In Wales, passenger journeys per capita declined by a quarter between 2004-05 and 2018-19 (Figure 1).
The onset of the pandemic saw passenger journeys collapse. In 2020-21, the number of passenger journeys per capita in Wales fell to about a quarter of pre-pandemic levels (Figure 1). These passenger numbers have struggled to recover. In 2021-22 they were only half of the pre-COVID level (Figure 1).
Figure 1 also shows that journeys per capita have been consistently lower in Wales compared with other parts of the UK over the last two decades, and slower to recover following the pandemic. In 2021-22, journeys per capita in Scotland were 2.5 times higher, and in England (outside London) 1.7 times higher, than in Wales.
Figure 2 shows a similar trend for bus occupancy since COVID-19. The average bus occupancy dropped by more than half following the pandemic, and was still below pre-COVID levels in 2021-22.
Figures: Passengers and occupancy
Figure 1: Number of passenger journeys on local bus services in Wales per capita, compared with England (outside London) and Scotland
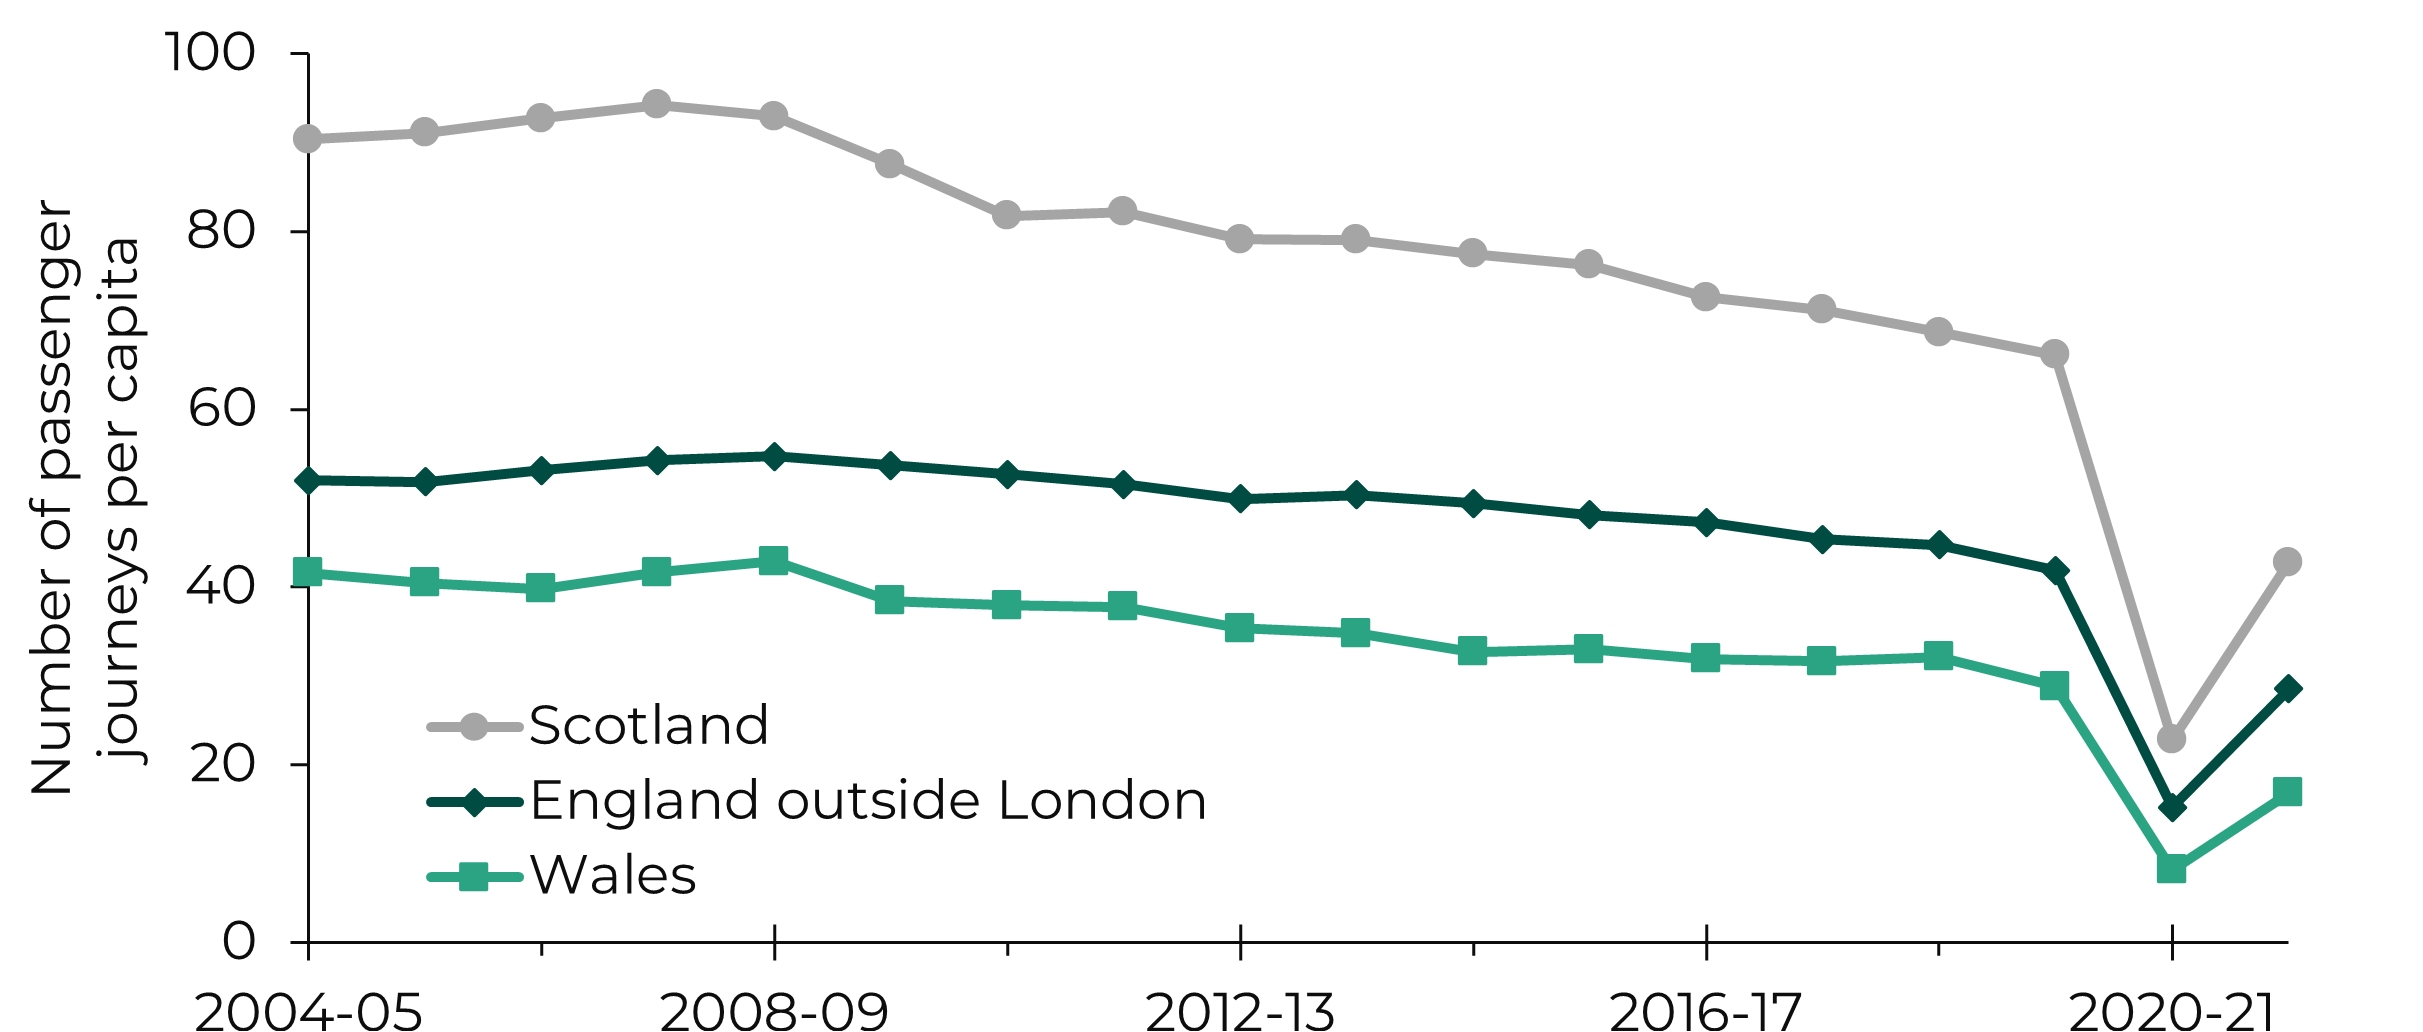
Source: UK Government - Department for Transport data, Senedd Research analysis.
The bus journeys include non-resident journeys, while the population only takes into account residents.Figure 2: Average bus occupancy in Wales, compared with England (outside London) and Scotland
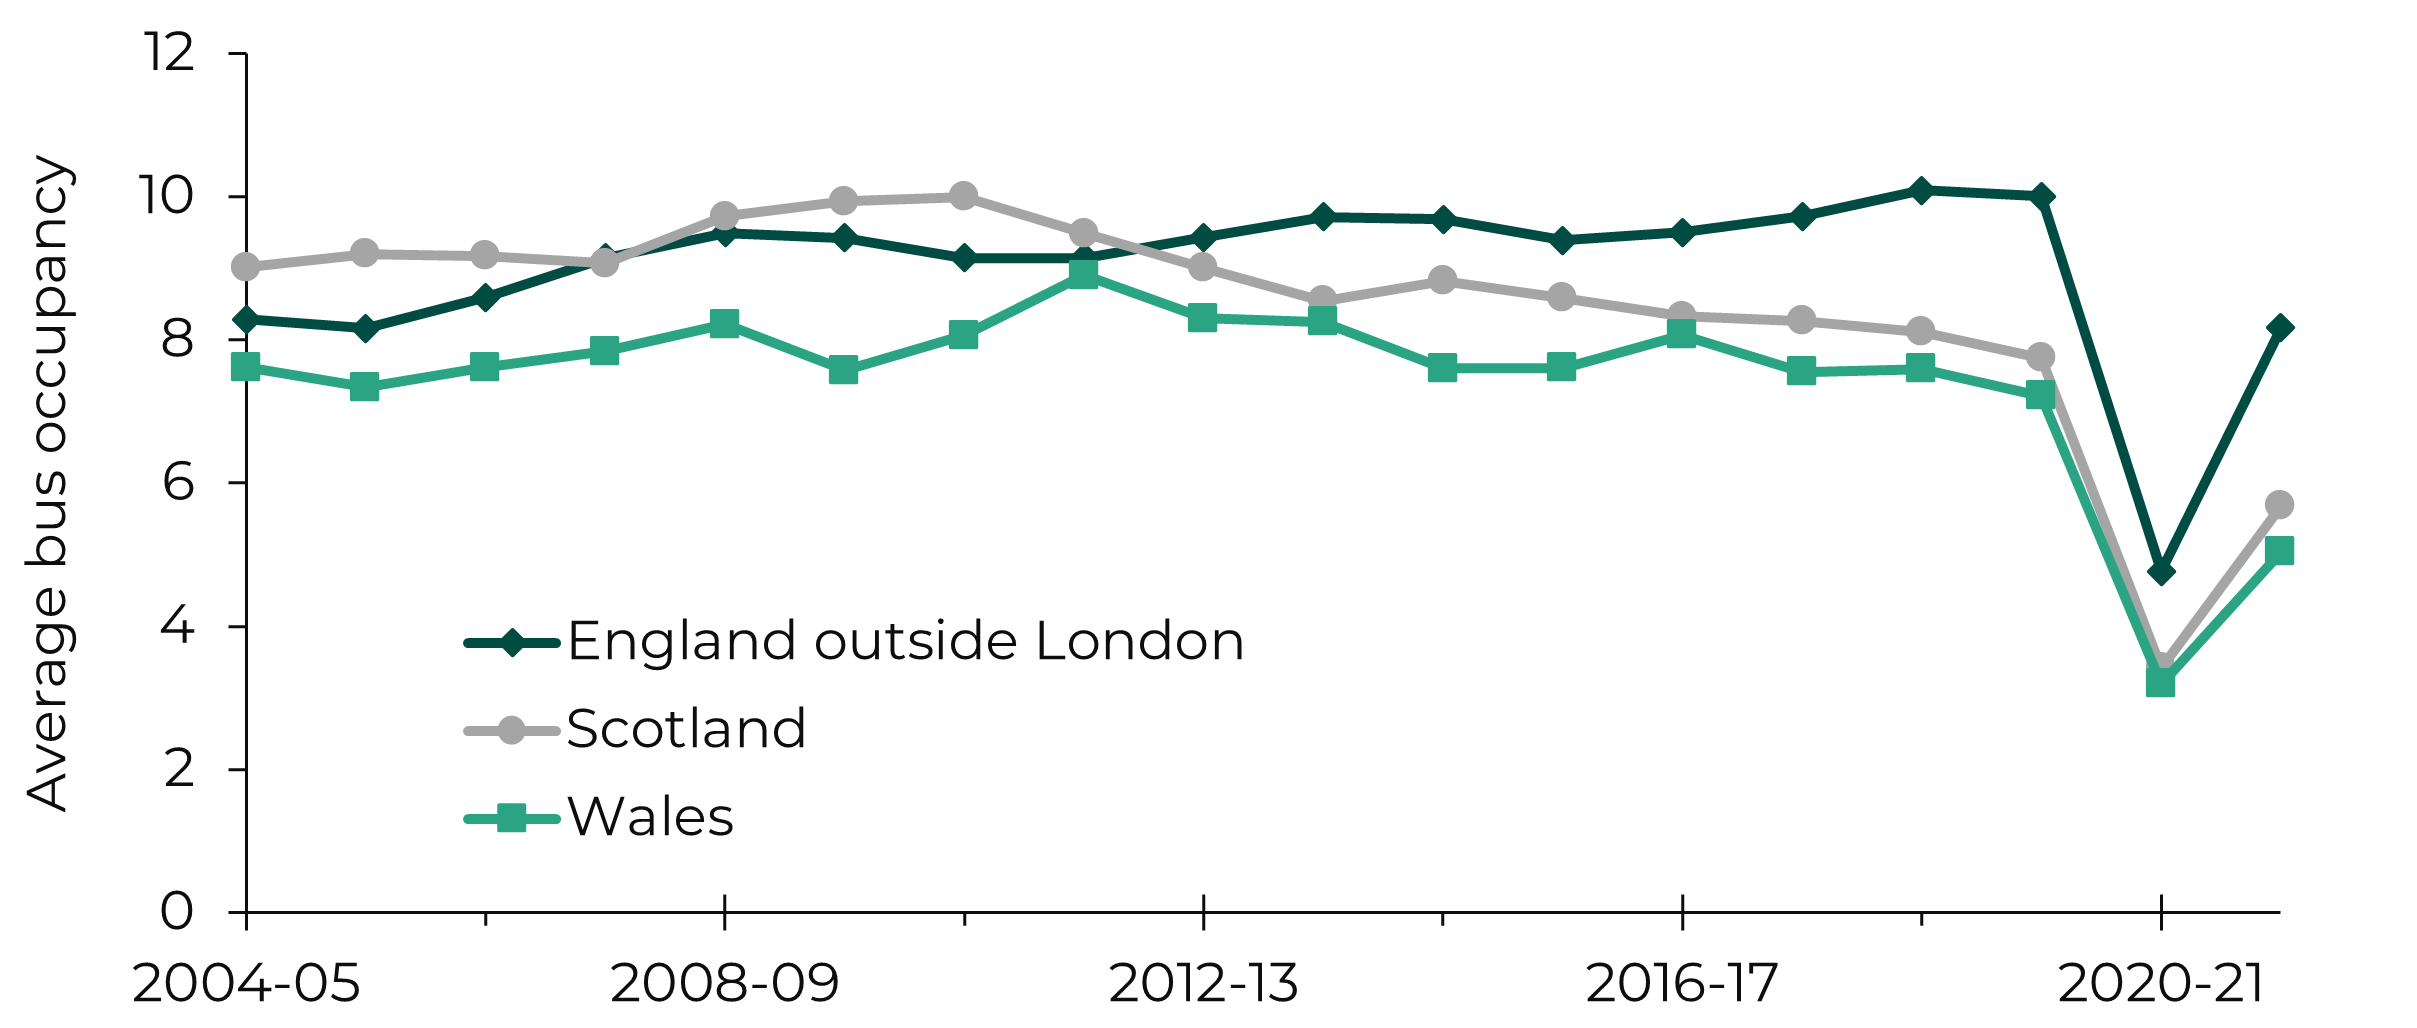
Source: UK Government - Department for Transport data, Senedd Research analysis.
Bus service levels are down
Figure 3 shows a long-term reduction in the distance travelled by local buses in Wales over the last twenty years, indicating a reduction in bus supply. This distance decreased by almost a fifth from 2004-05 to 2018-19. It then dropped by more than a third due to the pandemic, and has yet to return to pre-COVID levels.
Reports from the Confederation of Passenger Transport (CPT) Cymru and the Centre for Cities have both highlighted this issue. The Centre for Cities also showed that:
Wales was the nation in Great Britain where bus services… shrunk the most.
Research by Leeds University on behalf of Friends of the Earth showed that evening/night-time and rural services are particularly poor outside of London, with Wales being one of the UK regions with the largest drops in bus services since 2008.
Figure 3: Vehicle miles on local bus services in Wales
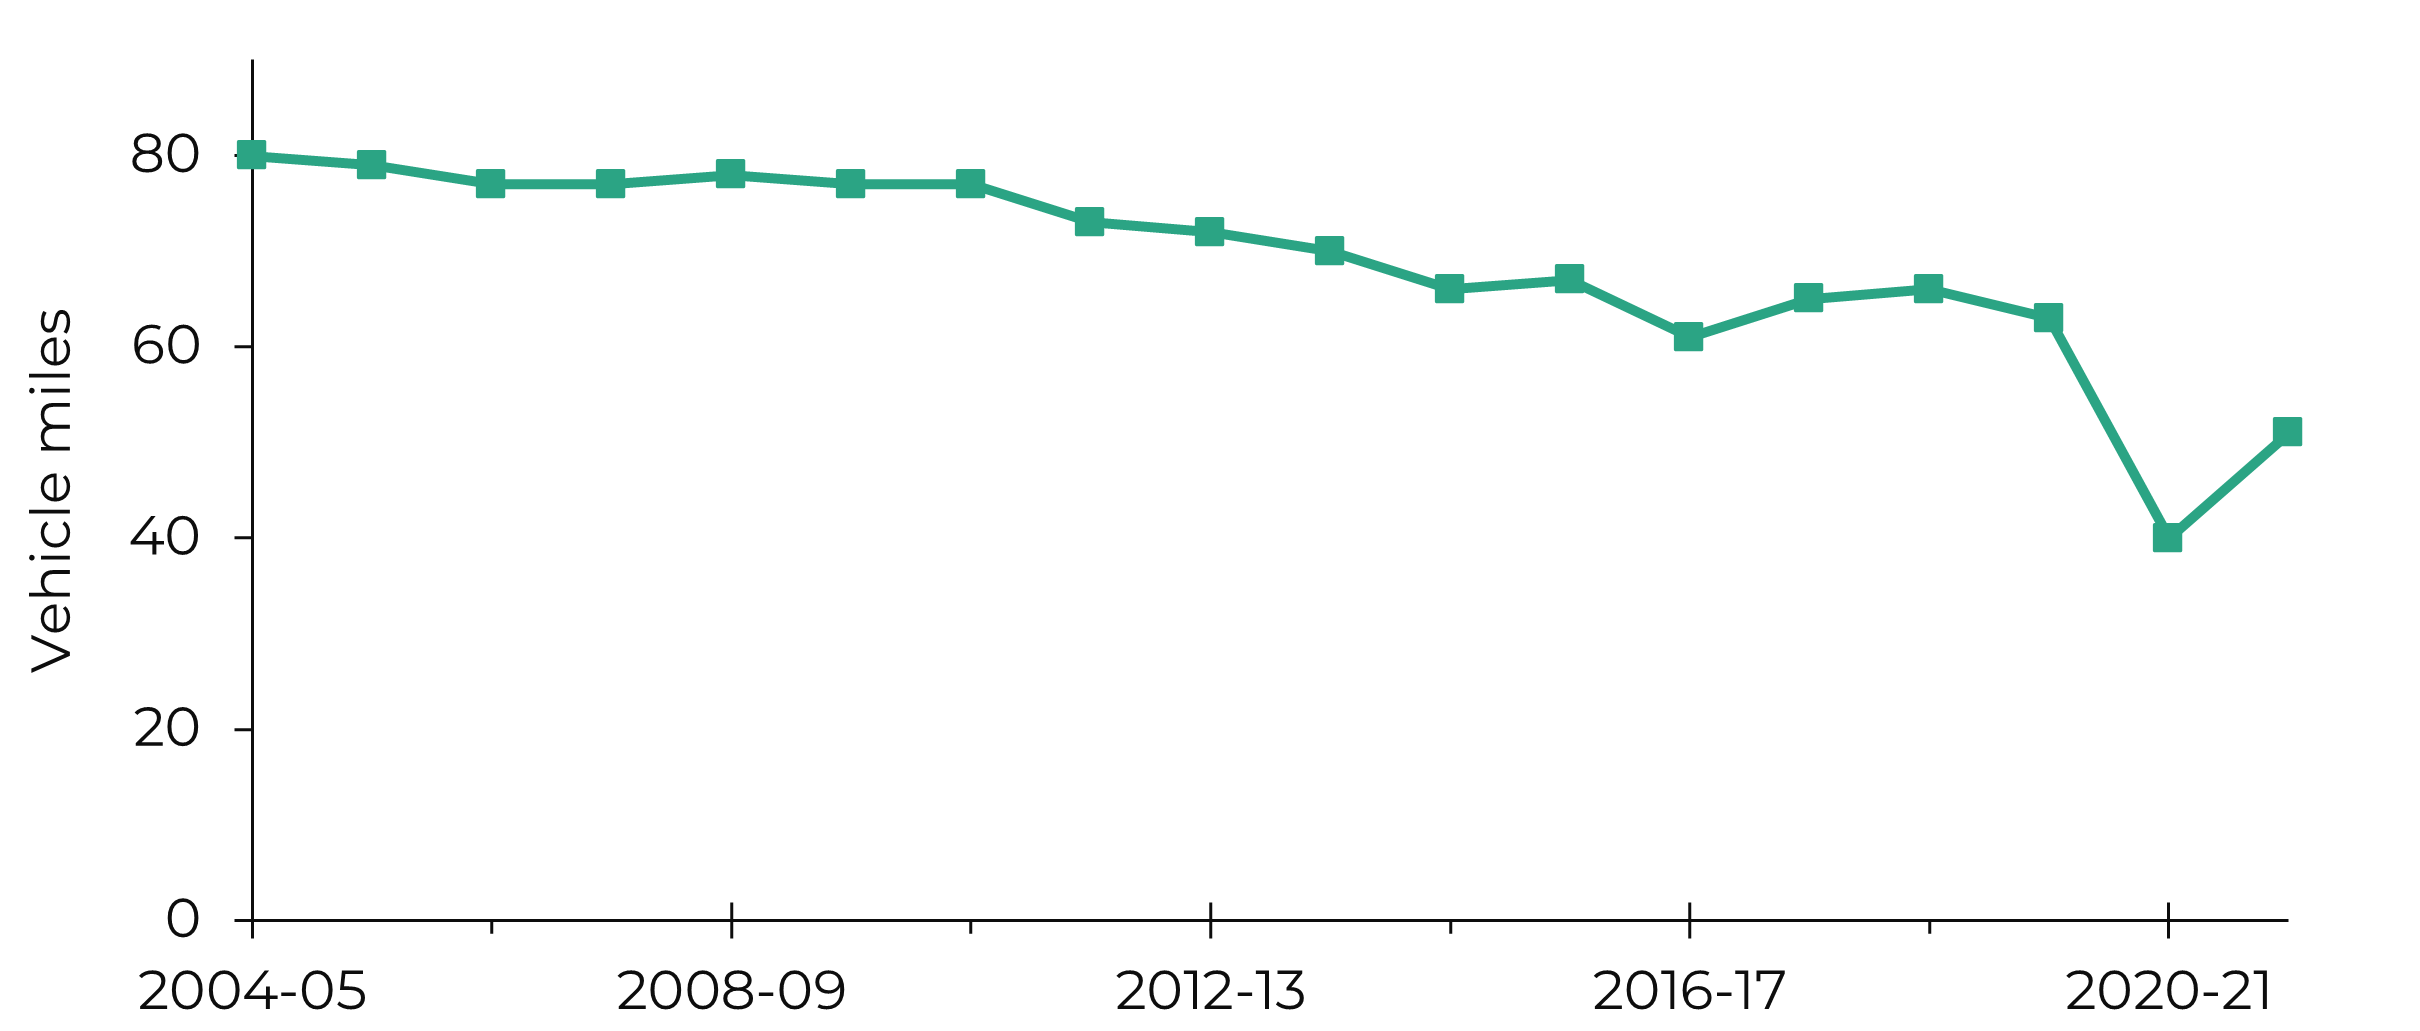
(Source: UK Government - Department for Transport data), Senedd Research analysis
Bus operating costs have overtaken operating revenue
Bus fares in Wales, adjusted for inflation, have increased by almost a fifth in the last two decades (Figure 4).
Over the last fifteen years, the proportion of concessionary fares has also increased, by more than a tenth. It has been consistently higher than in Scotland and England (outside London) over the same period (Figure 5).
This can be an issue for operators. The law requires operators are no better or worse off as a result of carrying concessionary passengers, meaning they are not reimbursed a the full fare by local authorities.
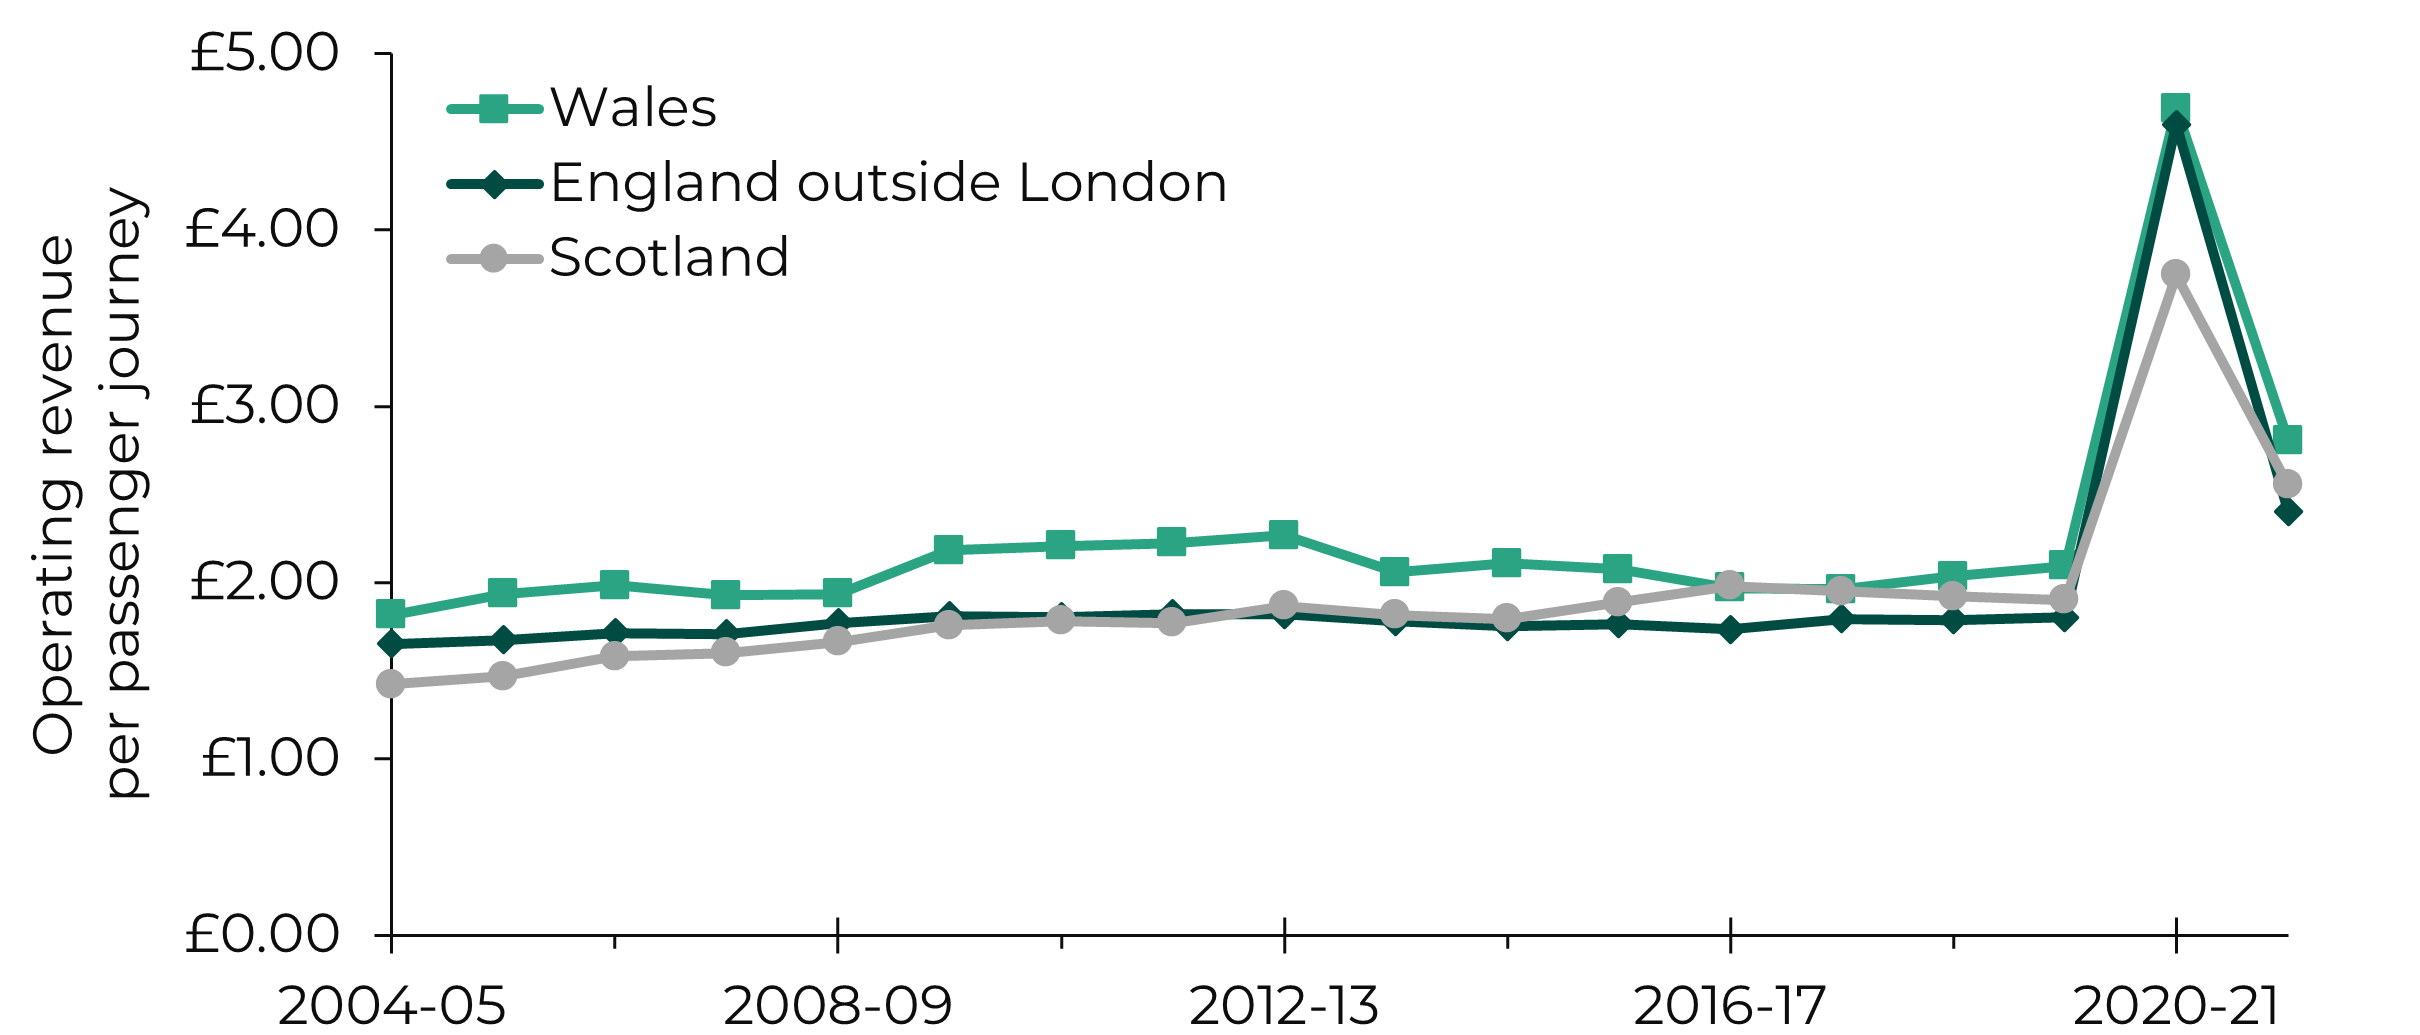
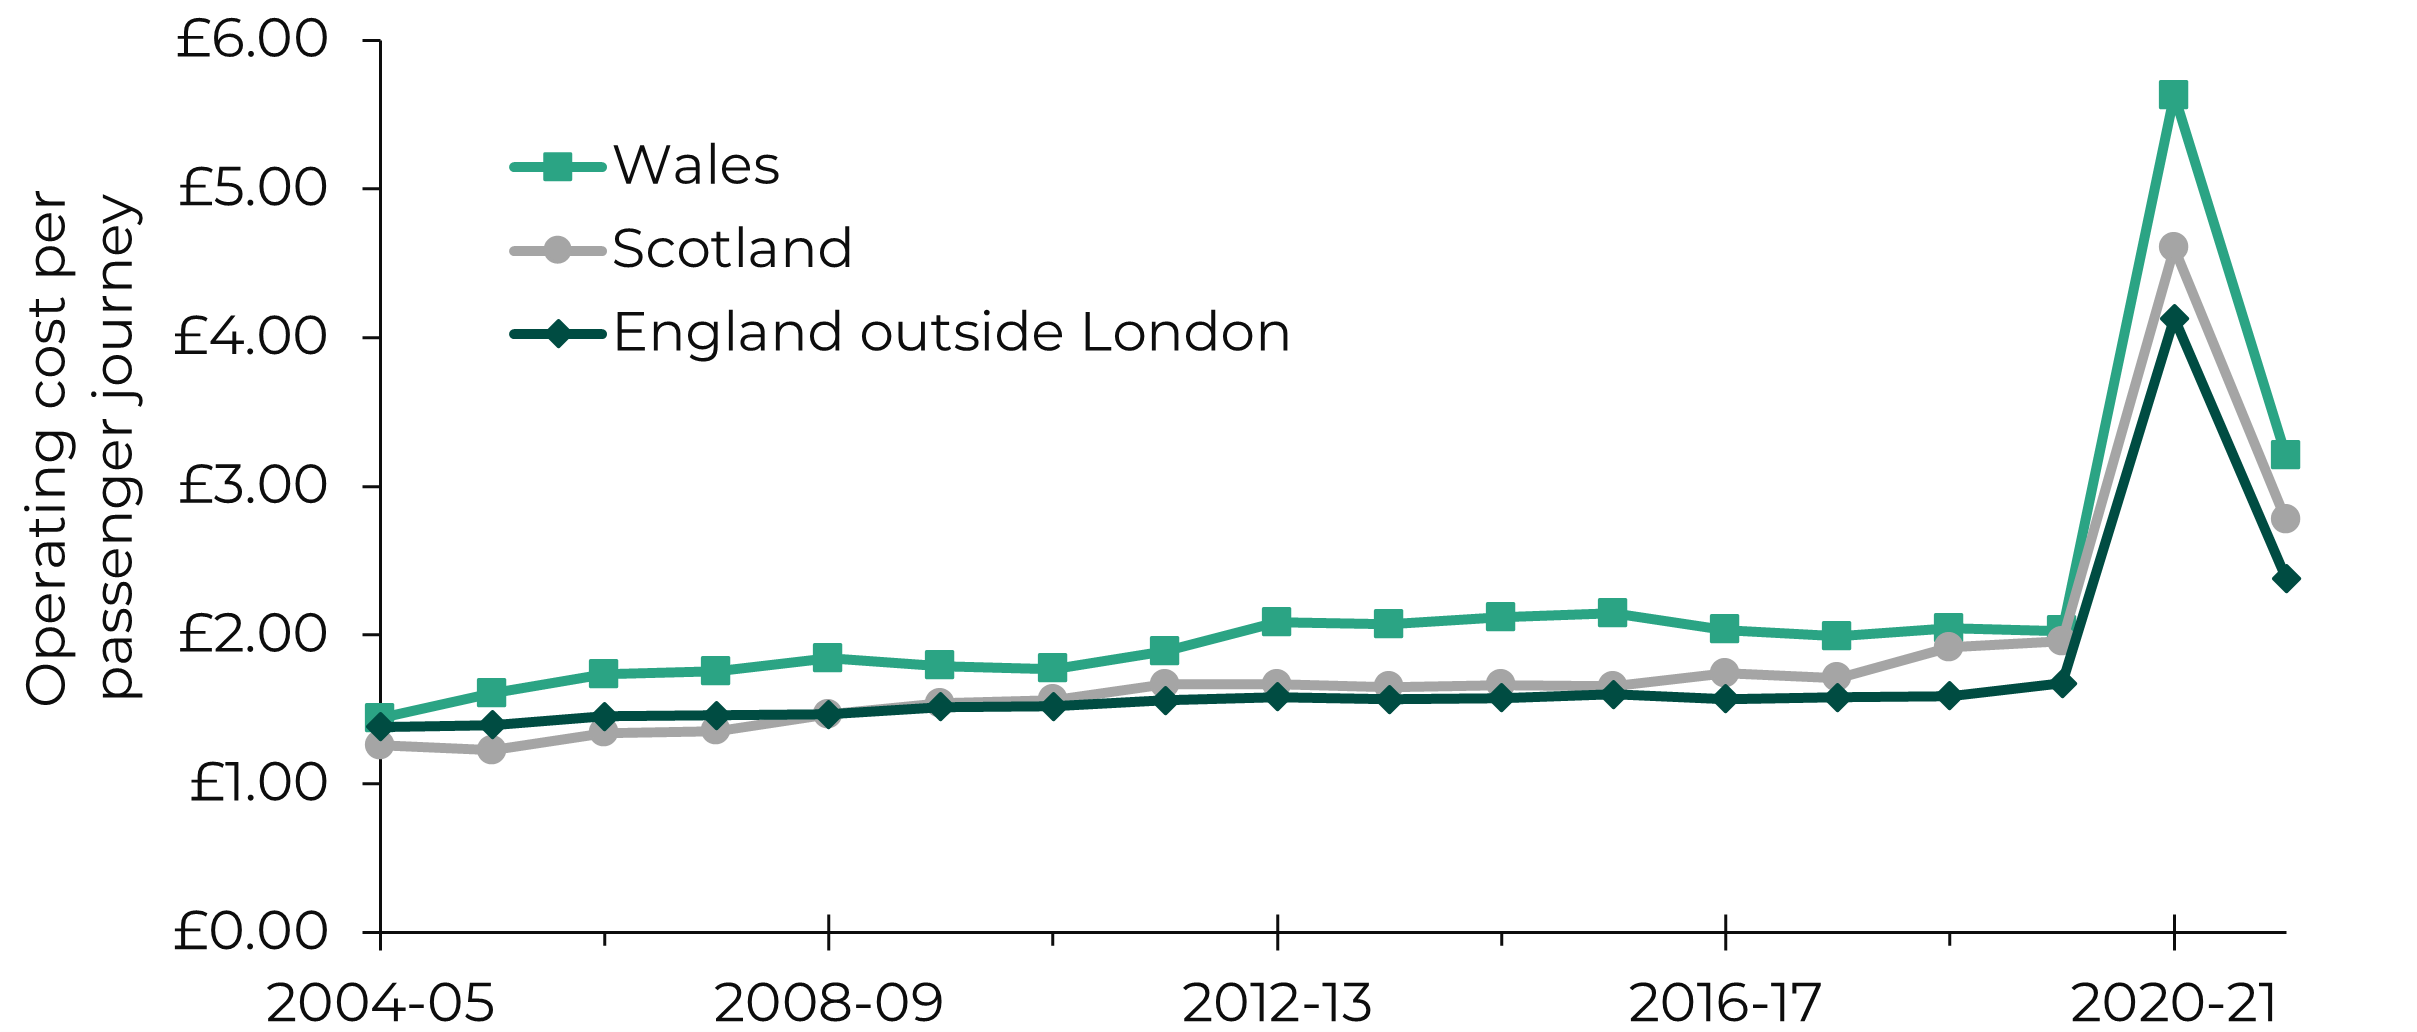
Welsh operating costs and revenues per passenger journey have both been higher compared with Scotland and England (outside London) over the last two decades (Figure 6). However, the difference between Wales and the other nations is larger for operating cost than revenue.
Since 2013-14, operating costs have also been higher than revenues in Wales (Figure 7).
Figures: Cost and Revenue
Figure 4: Local bus fares index in Wales in constant prices, adjusted for inflation (March 2005=100)
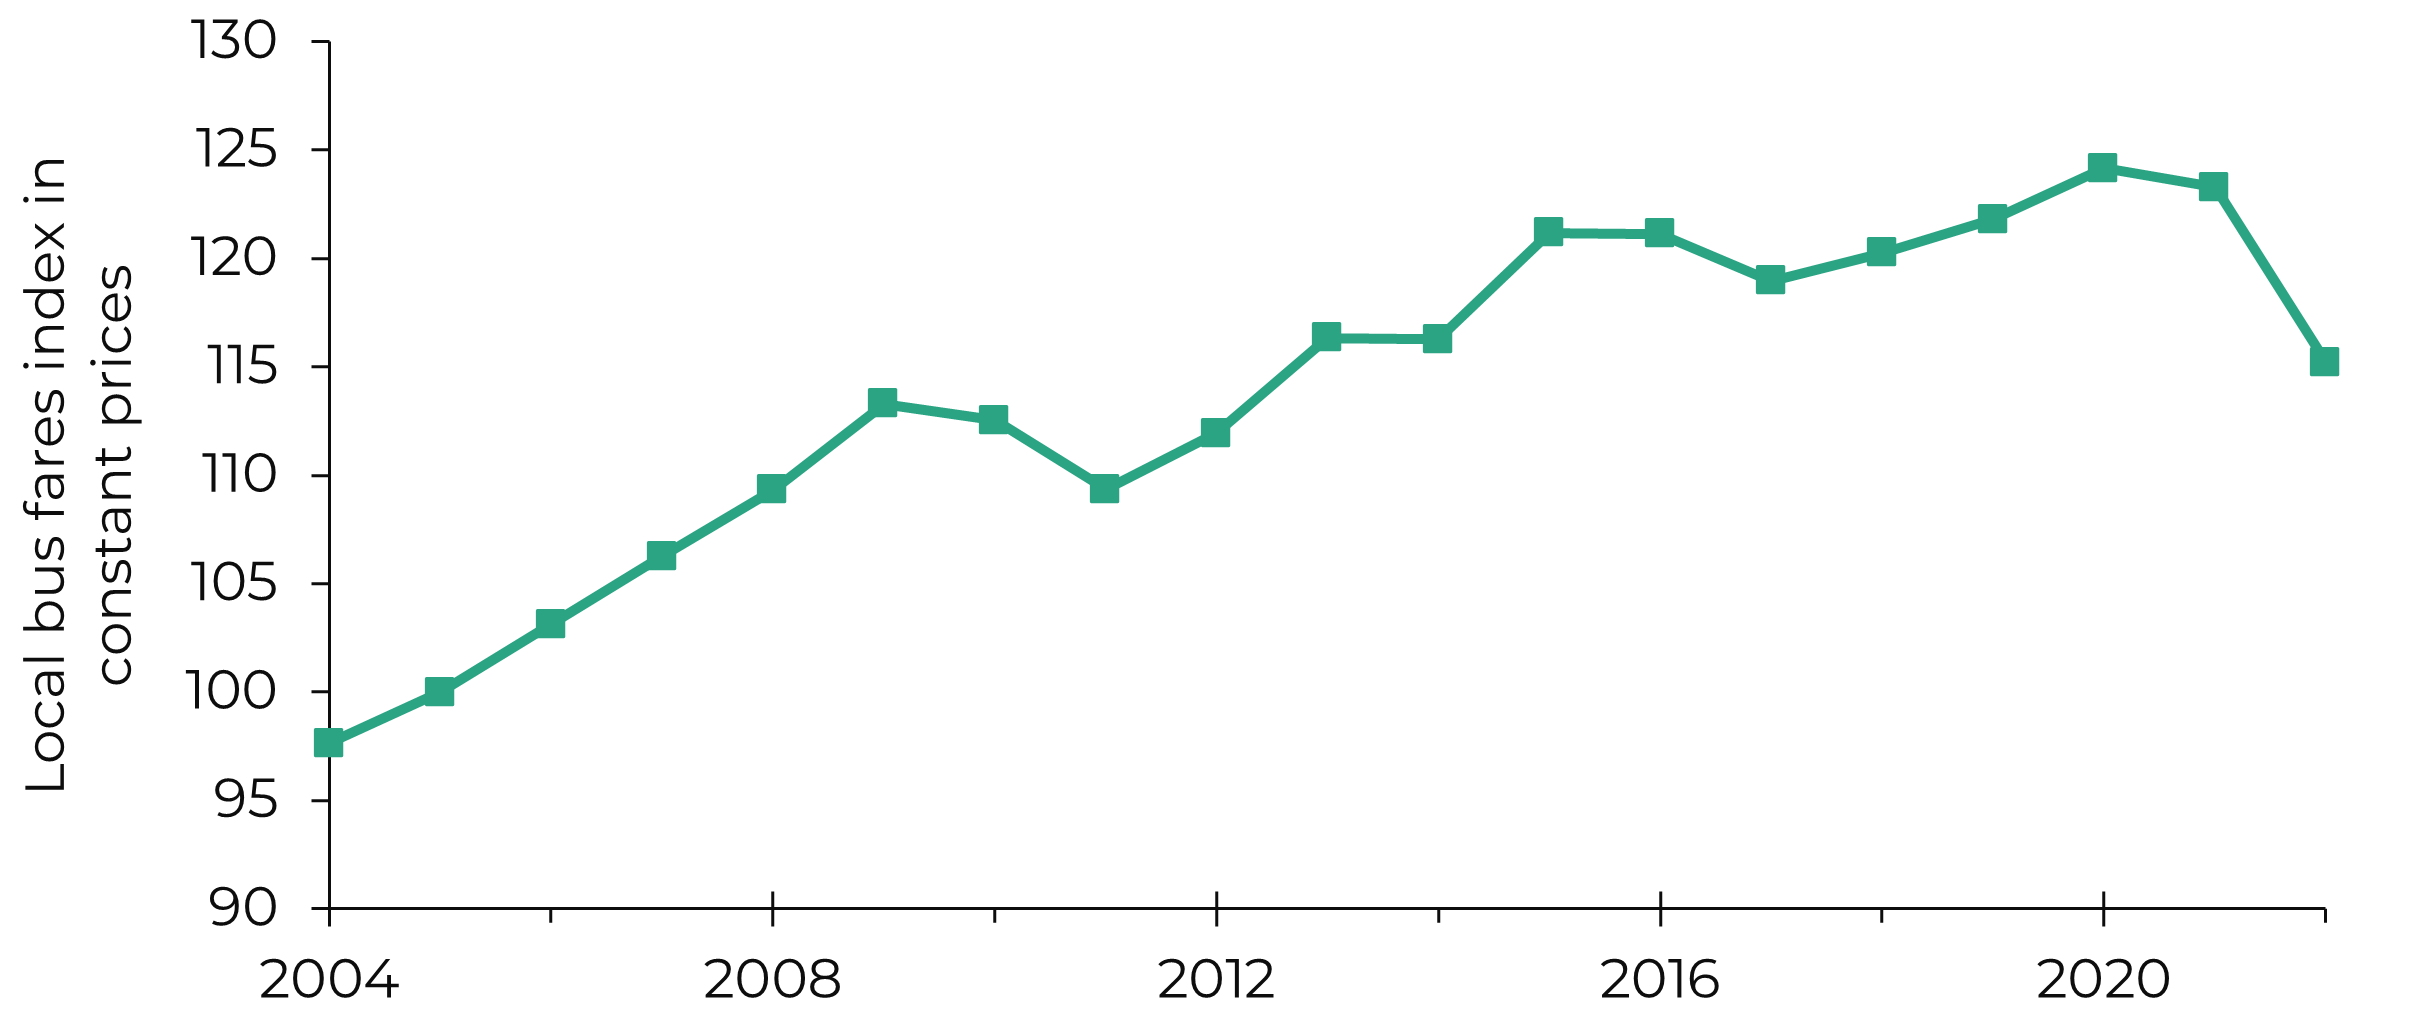
Source: UK Government - Department for Transport data, Senedd Research analysis.
Figure 5: Proportion of concessionary fares in Wales, compared with England (outside London) and Scotland
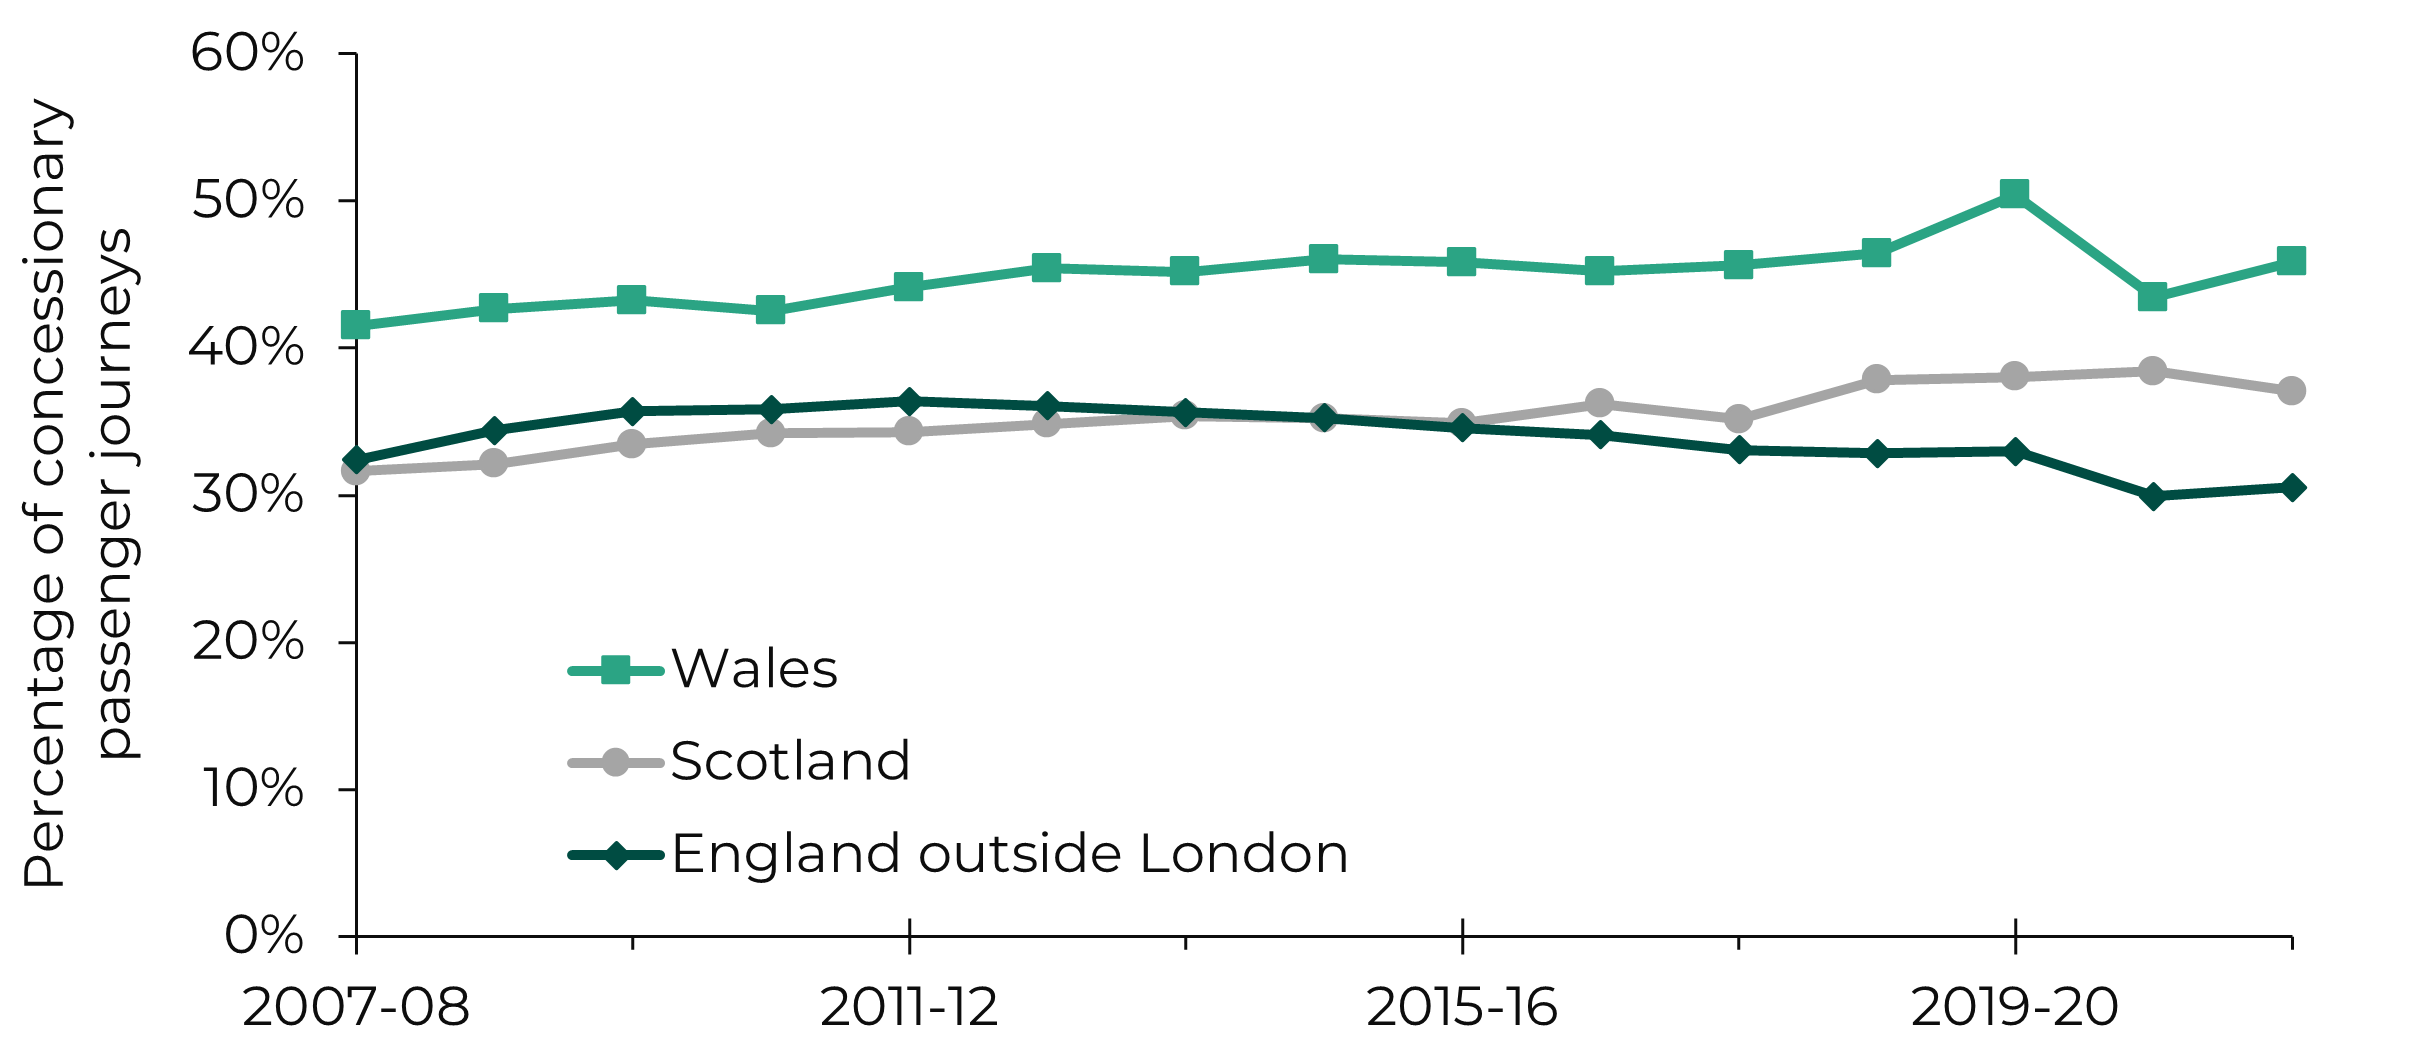
Source: UK Government - Department for Transport data, Senedd Research analysis.
Concessionary fares include elderly, disabled and youth schemes.Figure 6a: Operating cost per passenger journey on local bus services in Wales in constant prices adjusted for inflation, compared with England (outside London) and Scotland
Source: UK Government - Department for Transport data, Senedd Research analysis.
Figure 6b: Operating revenue per passenger journey on local bus services in Wales in constant prices adjusted for inflation, compared with England (outside London) and Scotland
Source: UK Government - Department for Transport data, Senedd Research analysis.
Figure 7: Comparison between revenue and cost per passenger journey on local bus services in Wales in constant prices adjusted for inflation
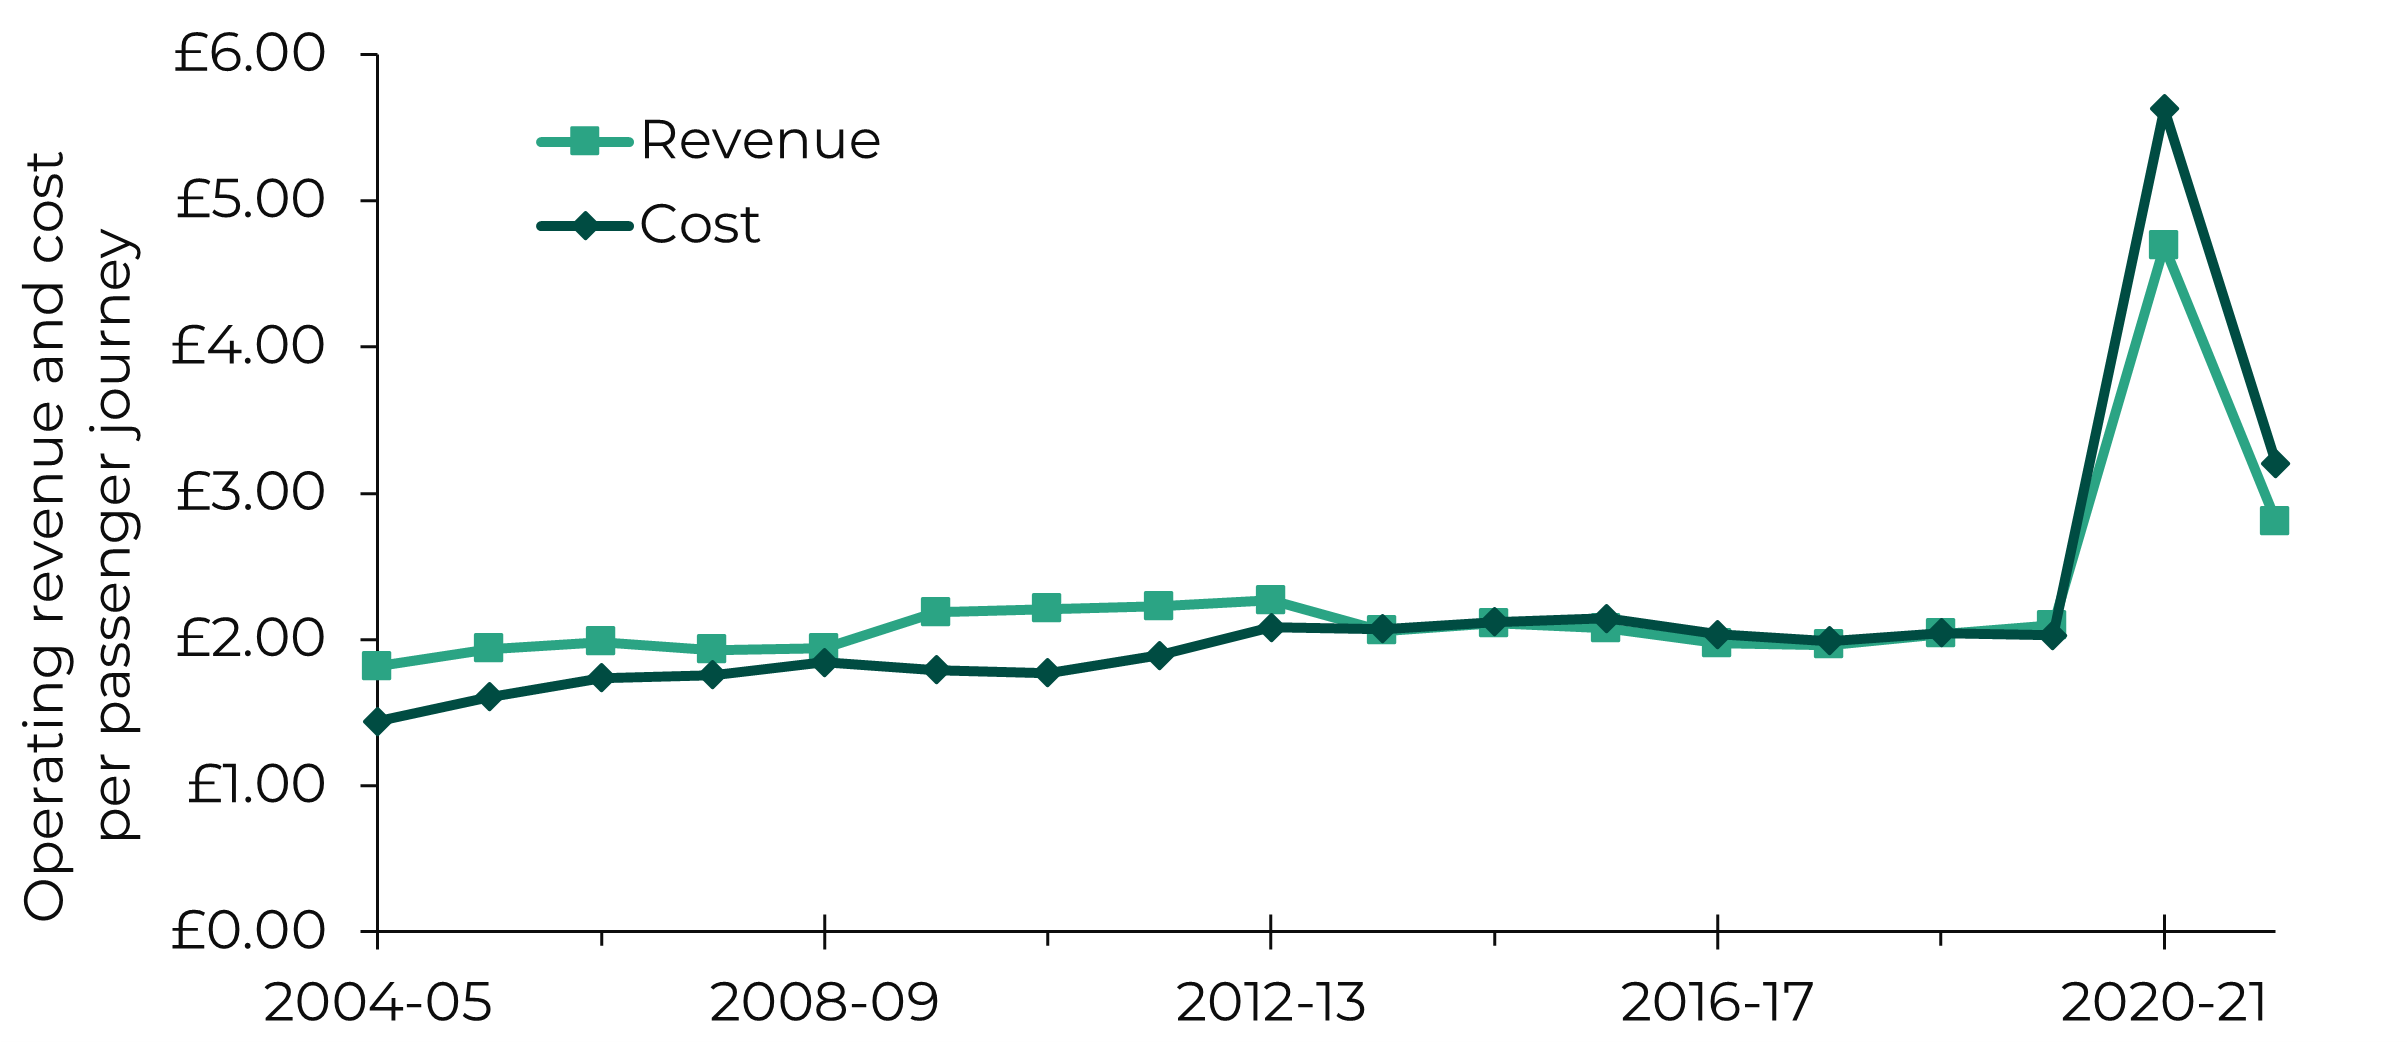
Source: UK Government - Department for Transport data, Senedd Research analysis.
Driver shortages have been an issue for some time
The Climate Change, Environment and Infrastructure (CCEI) Committee’s 2022 inquiry into bus and rail services highlighted concerns about staff shortages and their impact on implementation of Welsh Government policy.
In 2021, Confederation of Passenger Transport (CPT) Cymru suggested that bus drivers left the sector to work in other industries after the pandemic, including the haulage industry, as there was “greater pay on offer”.
CPT Cymru also said a significant portion of drivers decided to retire early following COVID-19, due to health concerns. This analysis is supported by UK-wide data from the Office for National Statistics.
Figure 8 shows that the number of staff employed by local bus operators has decreased by more than a quarter between 2004-05 and 2021-22.
Figure 8: Staff employed by local bus operators in Wales
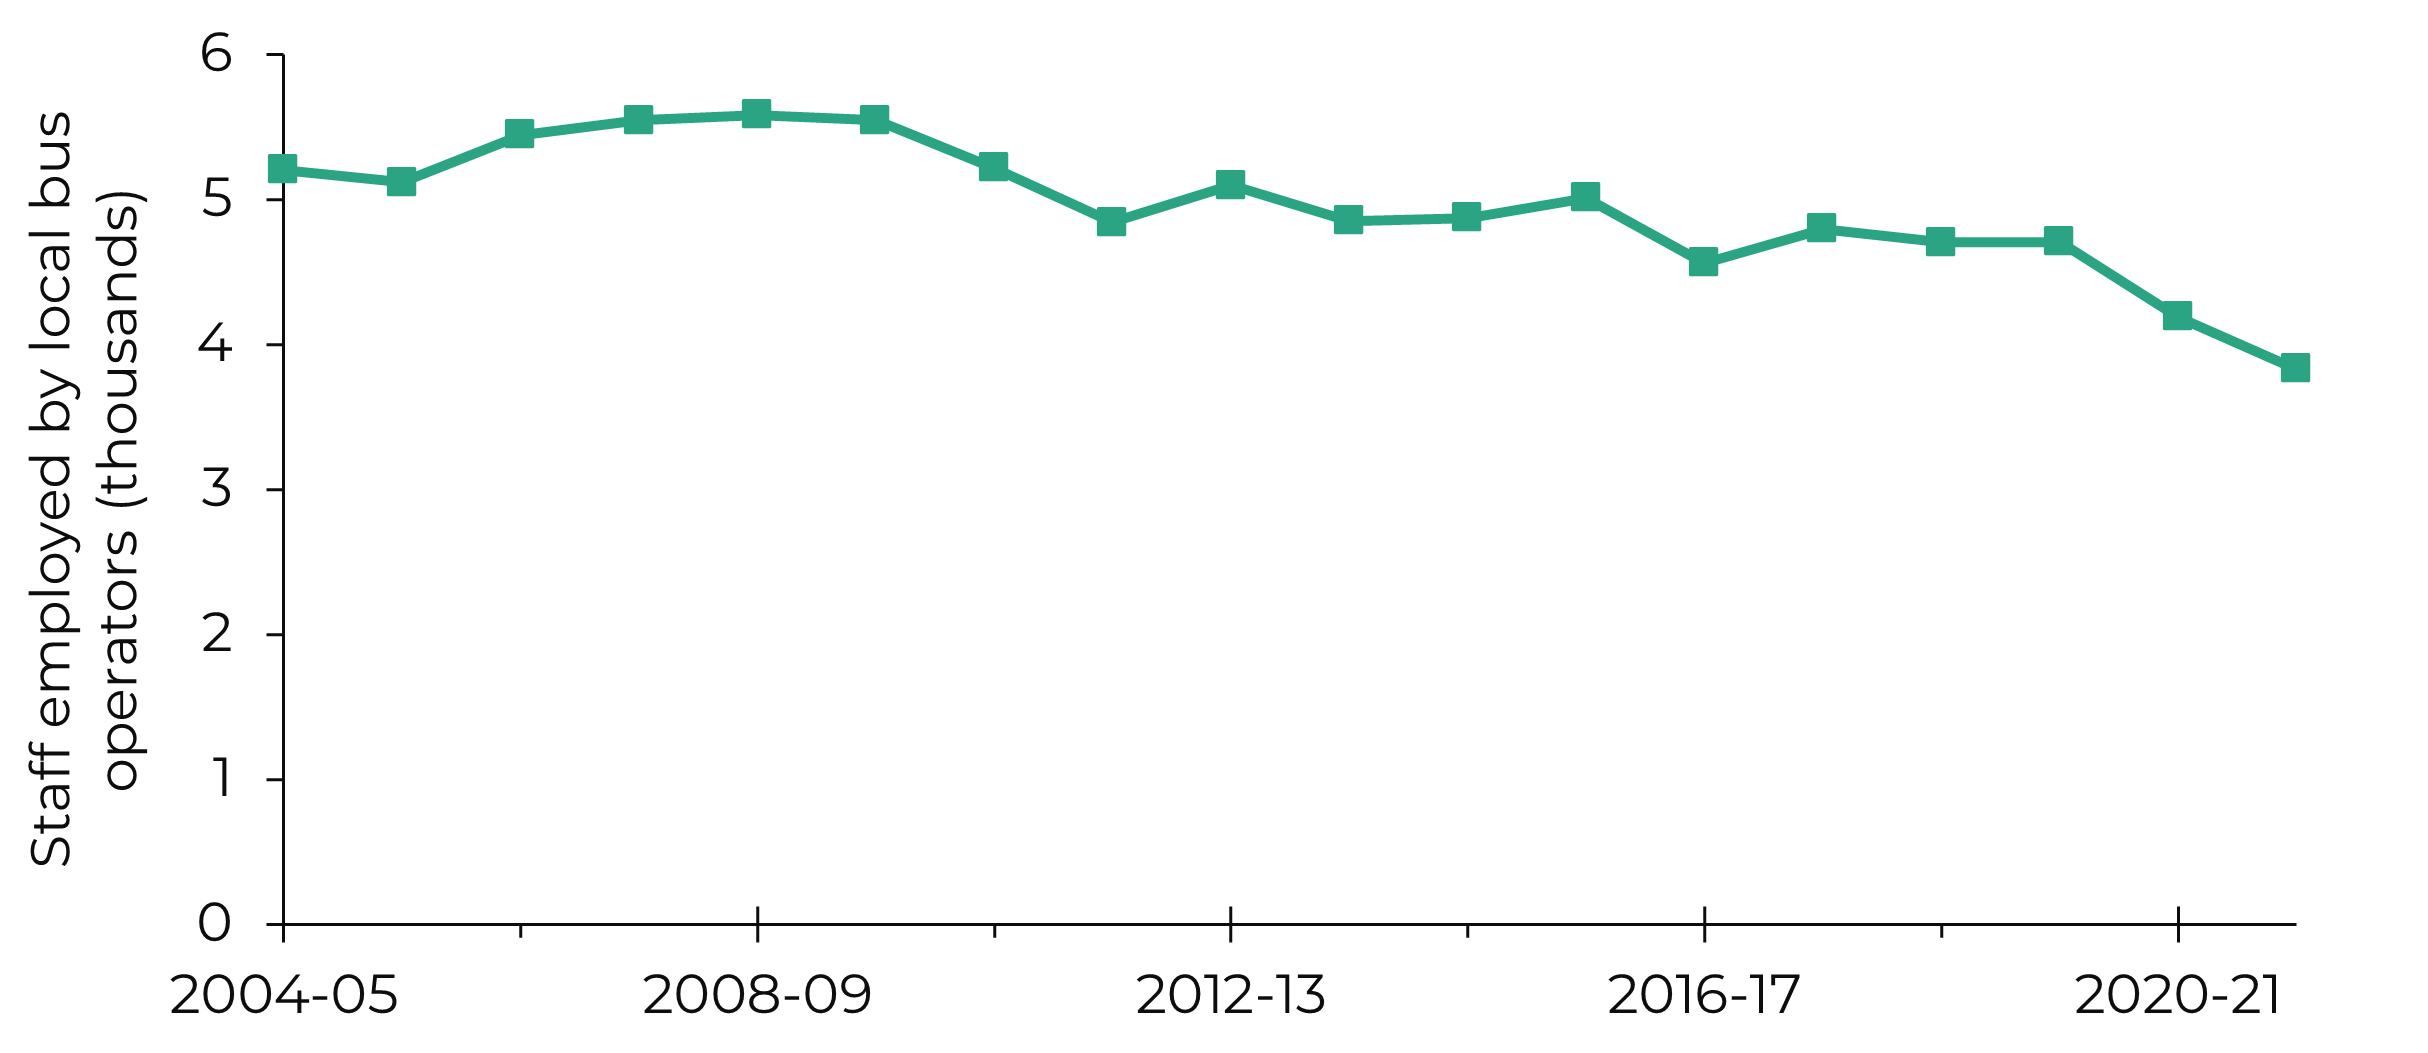
(Source: UK Government - Department for Transport data), Senedd Research analysis
What’s behind the issues?
CPT Cymru reports that operating costs have increased due to:
- an increase in interest rates and corporation taxes;
- limitations in investment, creating a backlog in vehicle replacement requirements; and
- additional capital costs for vehicles and infrastructure costs to introduce zero-emissions buses.
CPT Cymru suggests revenue has been impacted by the variations in both fare income and financial support from the Welsh Government (for example, additional support has been provided through the Bus Emergency Scheme to respond to COVID-19).
Passenger demand, which impacts fare income, is influenced by various inter-connected factors. CPT Cymru reports the main drivers of bus demand changes, between 2009 and 2019, were:
- a fall in demand for concessionary travel (the proportion of concessionary travel has however increased as seen in Figure 5);
- reductions in service supply;
- falls in demand for shopping trips as transactions moved online;
- car ownership growth;
- changes in fares; and
- a fall in bus speeds because of growing traffic congestion.
Low population densities in Wales are also a challenge for bus services. The Urban Transport Group (UTG) cites city shifts which favour active travel, and a shift to personalised on-demand services (e.g. taxis) as drivers of change.
Bus operators have expressed concerns about the impact of the new 20mph speed limit on bus services. A November 2023 report by the Centre for Cities recommends local authorities exempt bus lanes from the new 20mph speed limit, where “safe and appropriate”, to help buses compete against cars. However, prior to this report, the Welsh Government said the emphasis should be on bus prioritisation, for example bus lanes, instead of higher speeds.
CPT Cymru highlights limitations in determining the key drivers of bus performance changes due to a lack of data on:
…use by age, gender and socio-economic classification, recent trends in journey purpose and demand patterns in different regions and local authority areas.
The data outlined above shows COVID-19 had both short-term and long-term effects on passengers, occupancy, bus service supply, costs and revenues, with demand in Wales impacted more significantly by COVID-19 than other parts of the UK.
The impact across Wales was also not equally distributed. A Senedd Research guest article by academics at the University of South Wales showed that, between 2019 and 2021, the most deprived areas saw the greatest decline in their ability to access bus services.
Passengers using concessionary fares, who are reliant on buses, have also been particularly hit by COVID-19, especially elderly and disabled pass holders who saw their passenger numbers reduced by half.
In addition, CPT Cymru’s analysis shows that COVID-19 accelerated trends, such as hybrid working, online shopping, or online health consultations, which reduced the need for public transport.
Hope for improvement?
The Welsh Government has a target that, by 2040, 45% of journeys will made by public transport, walking and cycling. A bus reform Bill is expected this Senedd term which the Welsh Government hopes will help deliver on this goal.
In our second article of this series, we look at what’s expected from the Bill and the opinions of stakeholders.
Article by Amandine Debus, Senedd Research, Welsh Parliament
Senedd Research acknowledges the parliamentary fellowship provided to Amandine Debus by the Natural Environment Research Council, which enabled this article to be completed.