
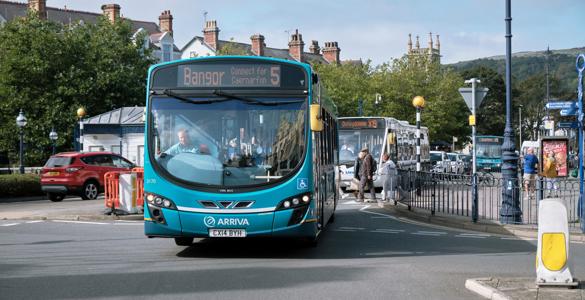
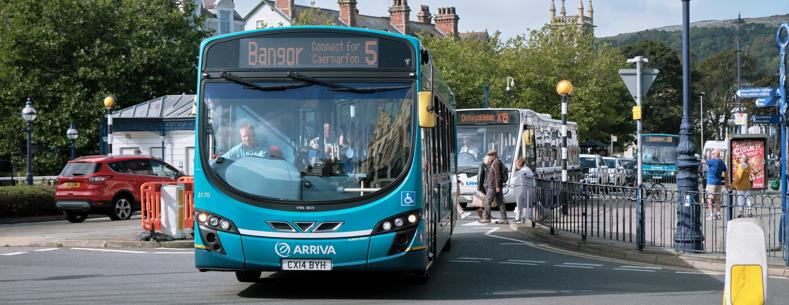
Academics at the University of South Wales, affiliated to WISERD, have looked at how the pandemic has affected bus service levels across Wales. Their guest article details how the most deprived areas – where people most depend on bus services - have been hardest hit.
Public transport is essential for many people to access services, yet much of Wales has suffered a decline in bus services during the pandemic due to withdrawn routes, reduced frequencies along routes, or removal of bus stops.
Transport for Wales submitted a paper to the Climate Change, Environment and Infrastructure Committee which states approximately 13% of households in Wales do not have a car, and 25% of bus users are disabled or have a long-term illness. In a recent Senedd debate on rural transport contributors also highlighted the role of transport services in combatting loneliness and isolation.
The COVID-19 pandemic has severely disrupted mobility patterns with ‘work from home’ requirements and social distancing having an impact on the demand for public transport services. Despite Welsh Government support for bus services via the Bus Emergency Scheme, some services were withdrawn, and others significantly reduced.
To assess the pandemic’s impact we’ve compared data on Welsh bus services from August 2019 to August 2021, and looked at data on public transport infrastructure.
Our analysis suggests a loss of 690 bus stops (about 3%) across Wales. Additionally, 150 fewer bus routes were operating (a loss of almost 15%), with service frequencies on the remaining routes declining by 22%. Overall, the opportunities to catch a bus (any bus, arriving at any bus stop, at any time) fell from 1.875 million to 1.446 million per week.
University of South Wales research, funded by ESRC’s Wales Institute of Socio-economic Research and Data (WISERD) initiative, has considered the wider implications of these changes. In particular, how they affected the ability of transport-disadvantaged groups and those living in sparsely-populated areas to access key services, such as libraries, bank branches, nursing and residential care places and sports facilities.
Our findings highlight the importance of bus services for vulnerable members of the community who often lack access to private transport.
Developing a Welsh Access to Bus Indicator
National public transport data can hide regional variations which can be unearthed through analysis of local provision.
The Scottish Parliament recently developed the Scottish Access to Bus Indicator (SABI) as an objective measure of local access to bus services. Analysis before the pandemic revealed greater accessibility in the most deprived deciles associated with the Scottish Index of Multiple Deprivation.
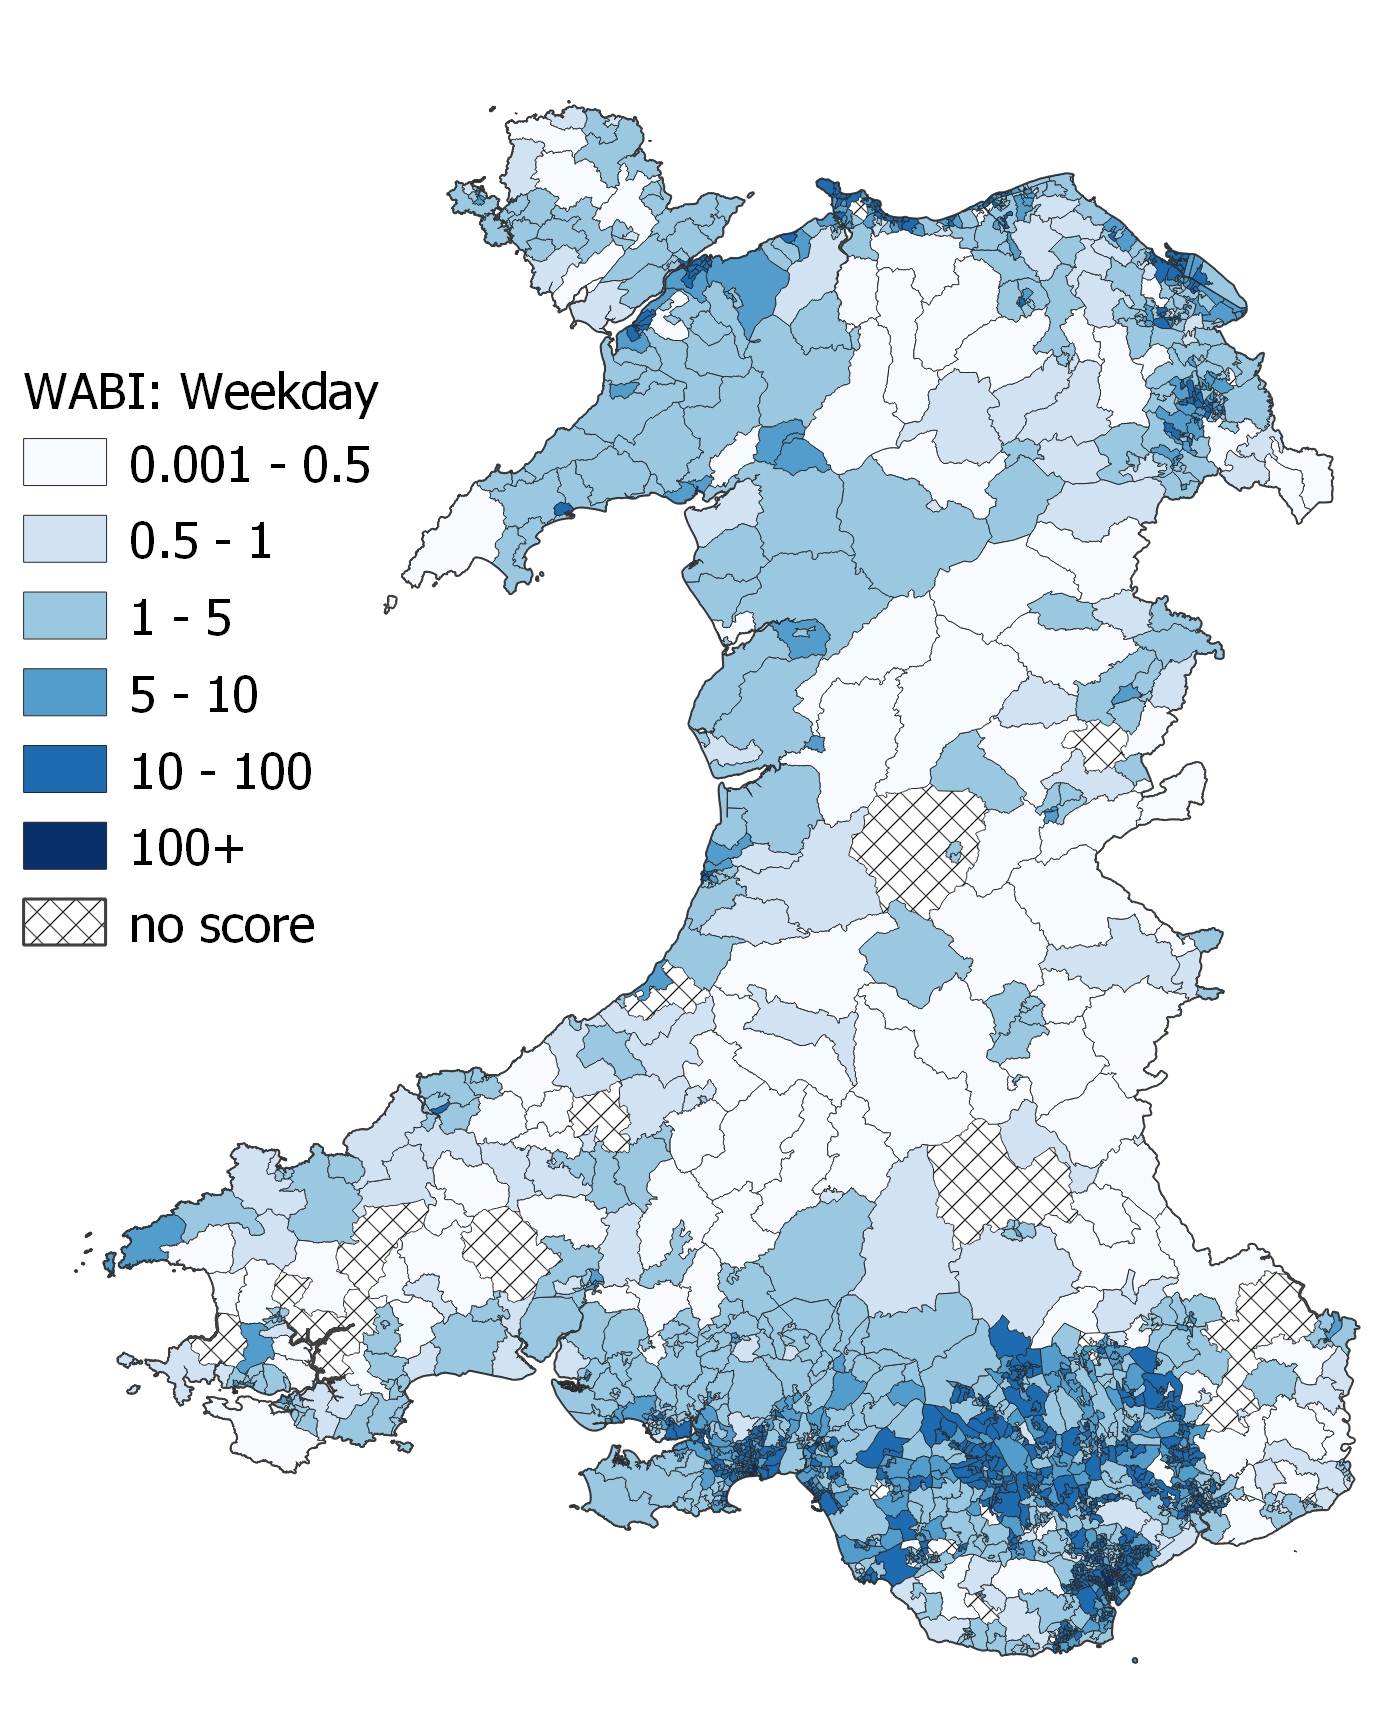
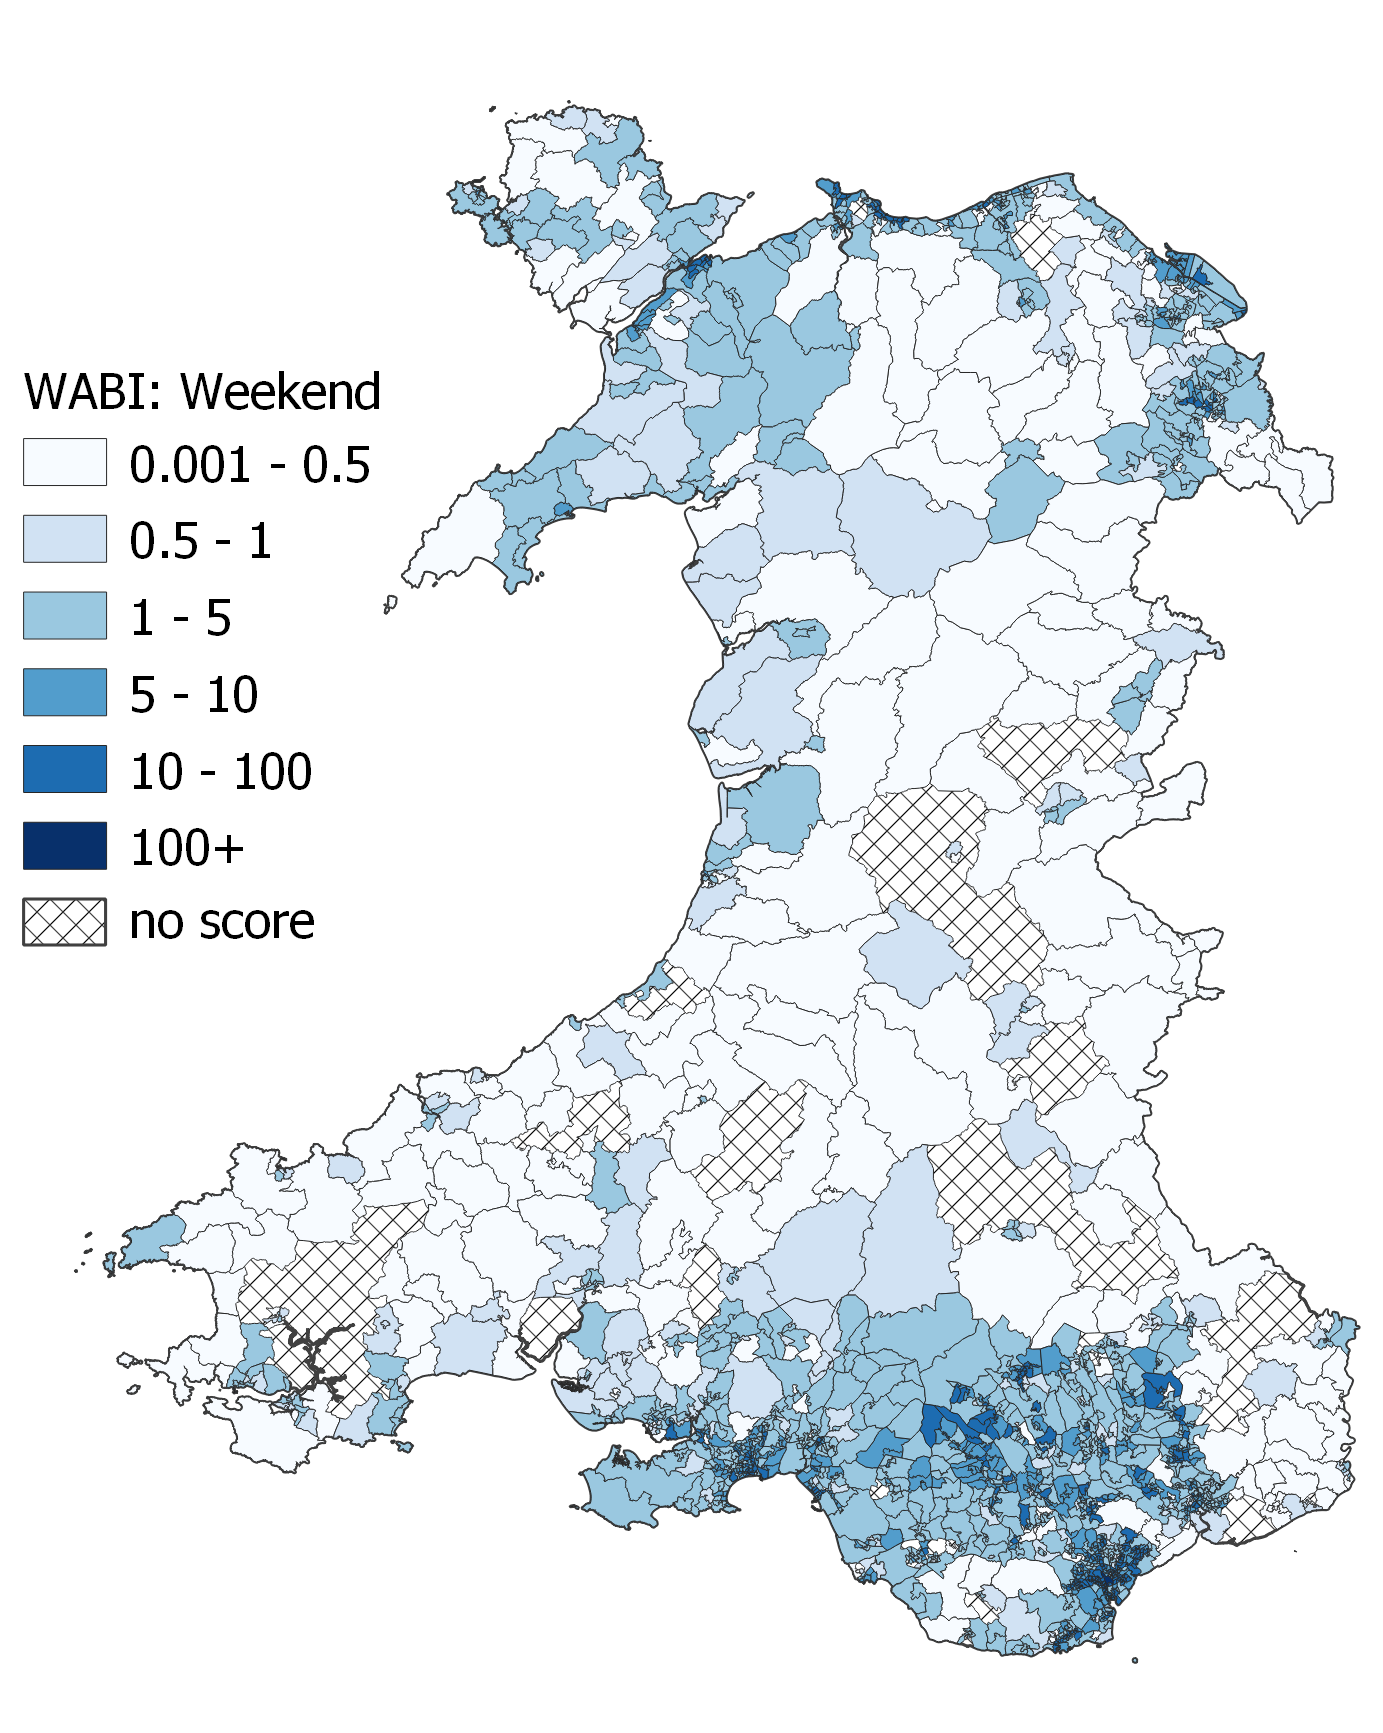
Our research adapts SABI into an equivalent Welsh Access to Bus Indicator (WABI). We calculated the average number of buses per hour (6am to 10pm) at bus stops within 400m walking distance of each Output Area centroid, then aggregated these to larger geographical areas (Lower Super Output Areas - LSOAs) using population-weighted averaging.
What did bus service levels look like in 2021?
Figure 1 maps WABI scores for August 2021. Not unexpectedly, broad patterns mirror the underlying population distribution, with the highest WABI scores in and around major urban conurbations. However, there are other variations alongside these dominant patterns, reflecting the specific routeways and frequency of services offered by service providers.
Figure 1. Accessibility of bus services in August 2021 (hatched symbol means no access recorded using this metric and a 400m walking distance limit from Output Area centroid)
 |
 |
How did service provision change between 2019 to 2021?
Our research draws on transport data for both August 2019 and August 2021. This allows us to see the changes in Welsh services during the recent pandemic.
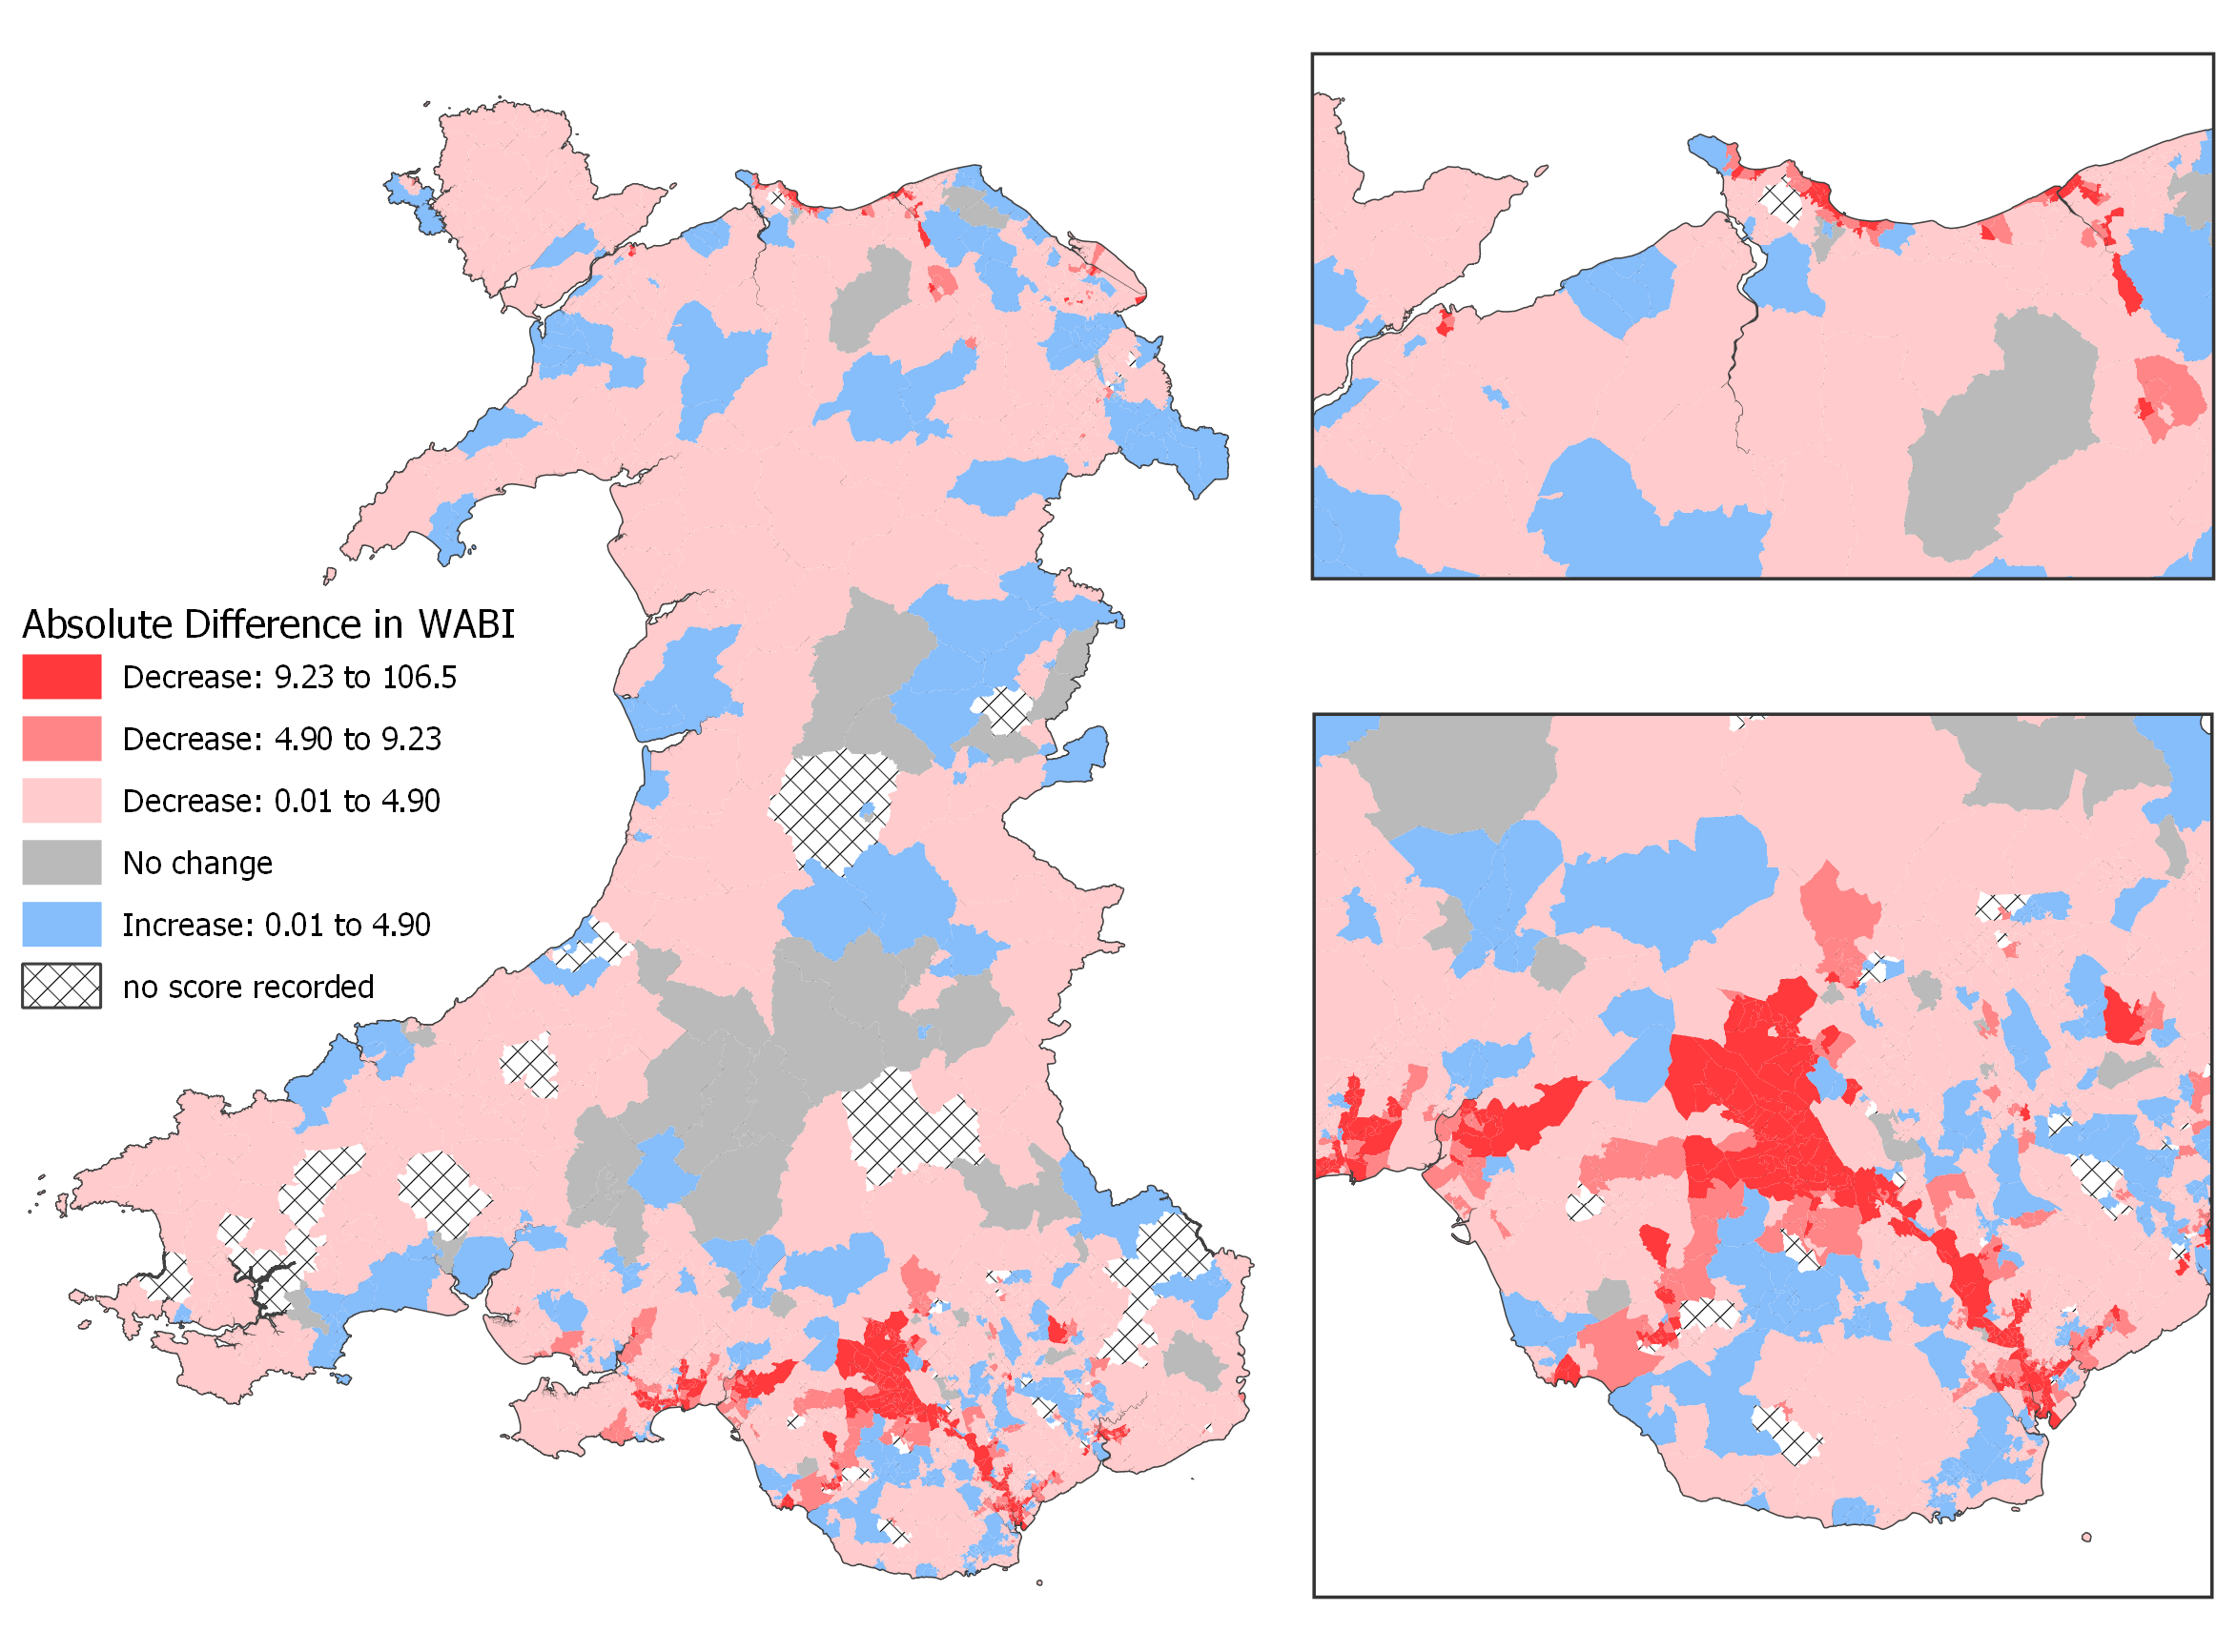
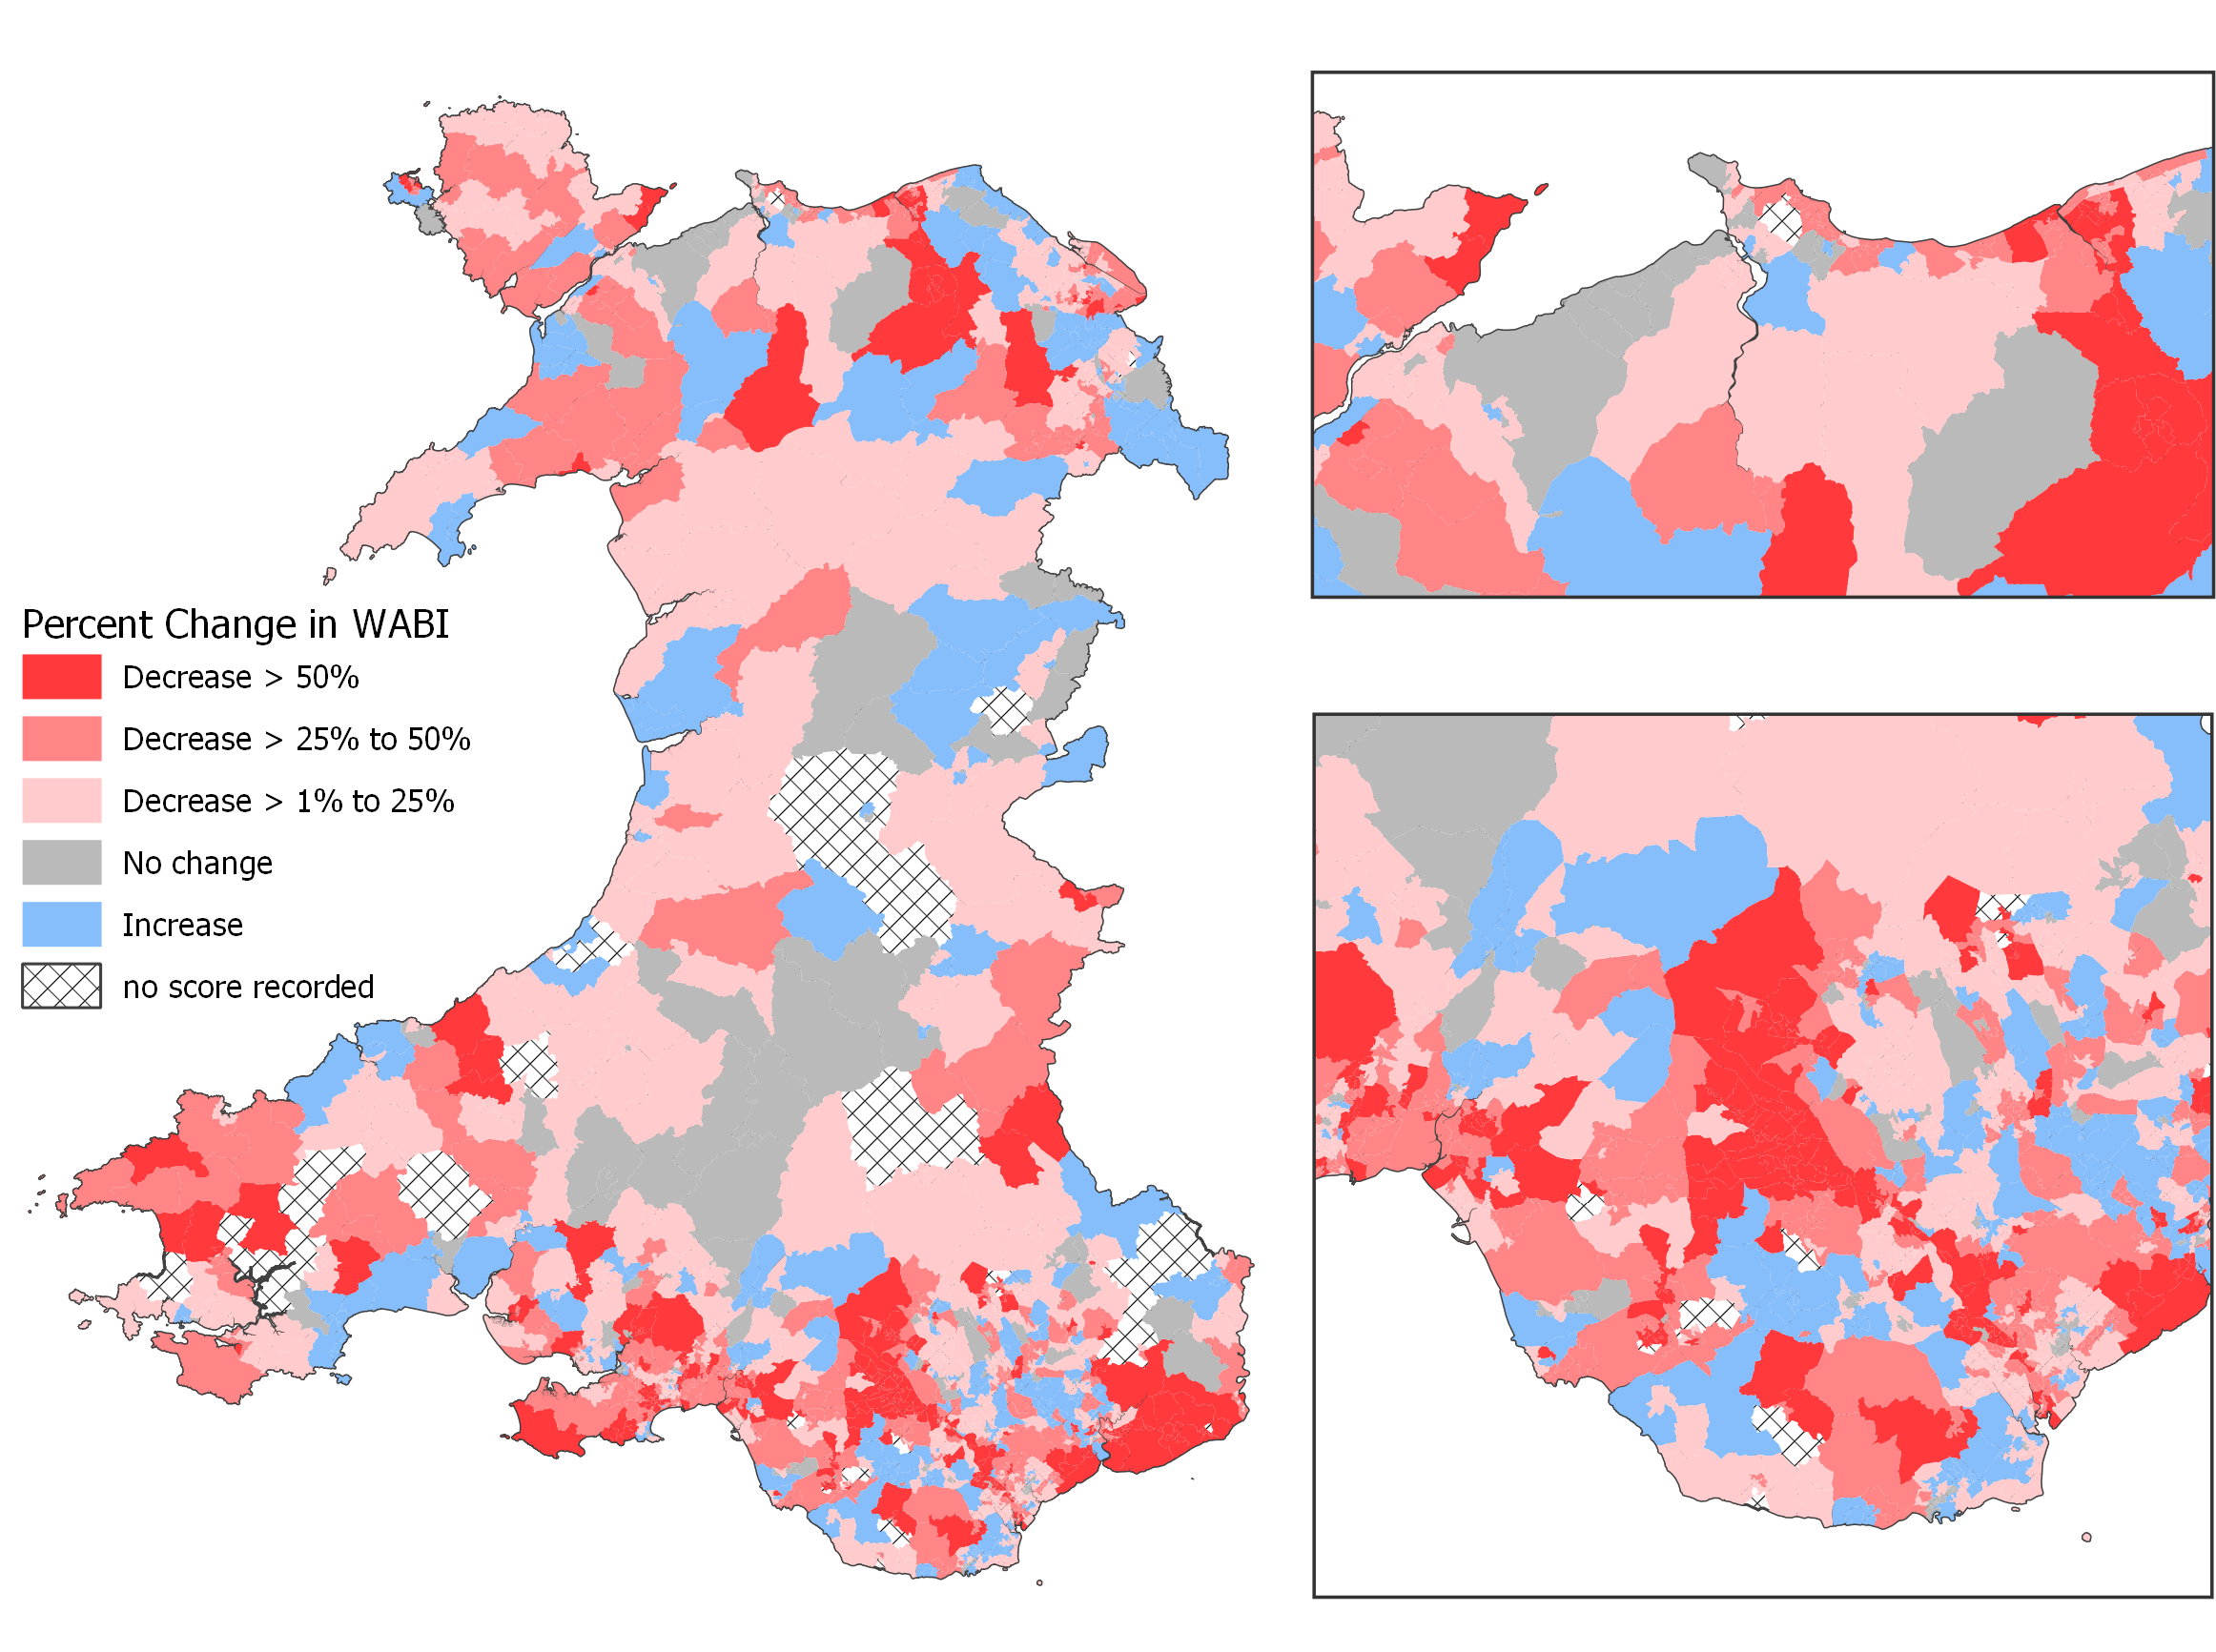
Maps were prepared of the absolute difference in WABI score and percentage change, as presented in Figure 2.
Whilst some LSOAs show small increases in bus accessibility, and others no change, most LSOAs (rural and urban) saw a net decline in bus services. Declines were highest and most concentrated within Rhondda Cynon Taf, although clusters in and around the inner-city areas of Cardiff and Swansea, and in the Neath Valley were evident too. Pockets along the north Wales coast also saw some of the biggest declines. Trends were broadly consistent between weekday and weekend services.
Large declines in absolute scores tended to occur in urban areas with naturally denser networks of bus services reflecting the population concentration being served. When expressed as a percentage decline, rural areas often showed the largest figures because the loss of just one or two opportunities can represent a large proportion of a small original total.
Areas witnessing an increase in provision are benefitting from higher trip frequencies, the introduction of a new route, or the provision of additional bus stops during this period.
Figure 2. Change in WABI score, weekday services, 2019 – 2021. The upper map shows the absolute score differences, the lower map the percentage change.
How do changes relate to deprivation?
We examined variations in services against the Welsh Index of Multiple Deprivation (WIMD), calculating the median WABI score amongst LSOAs belonging to each WIMD decile.
Figure 3: Median WABI score 2019 and 2021 by WIMD decile (above: weekdays, below: weekends) (WIMD Decile: 1 = most deprived; 10 = least deprived)
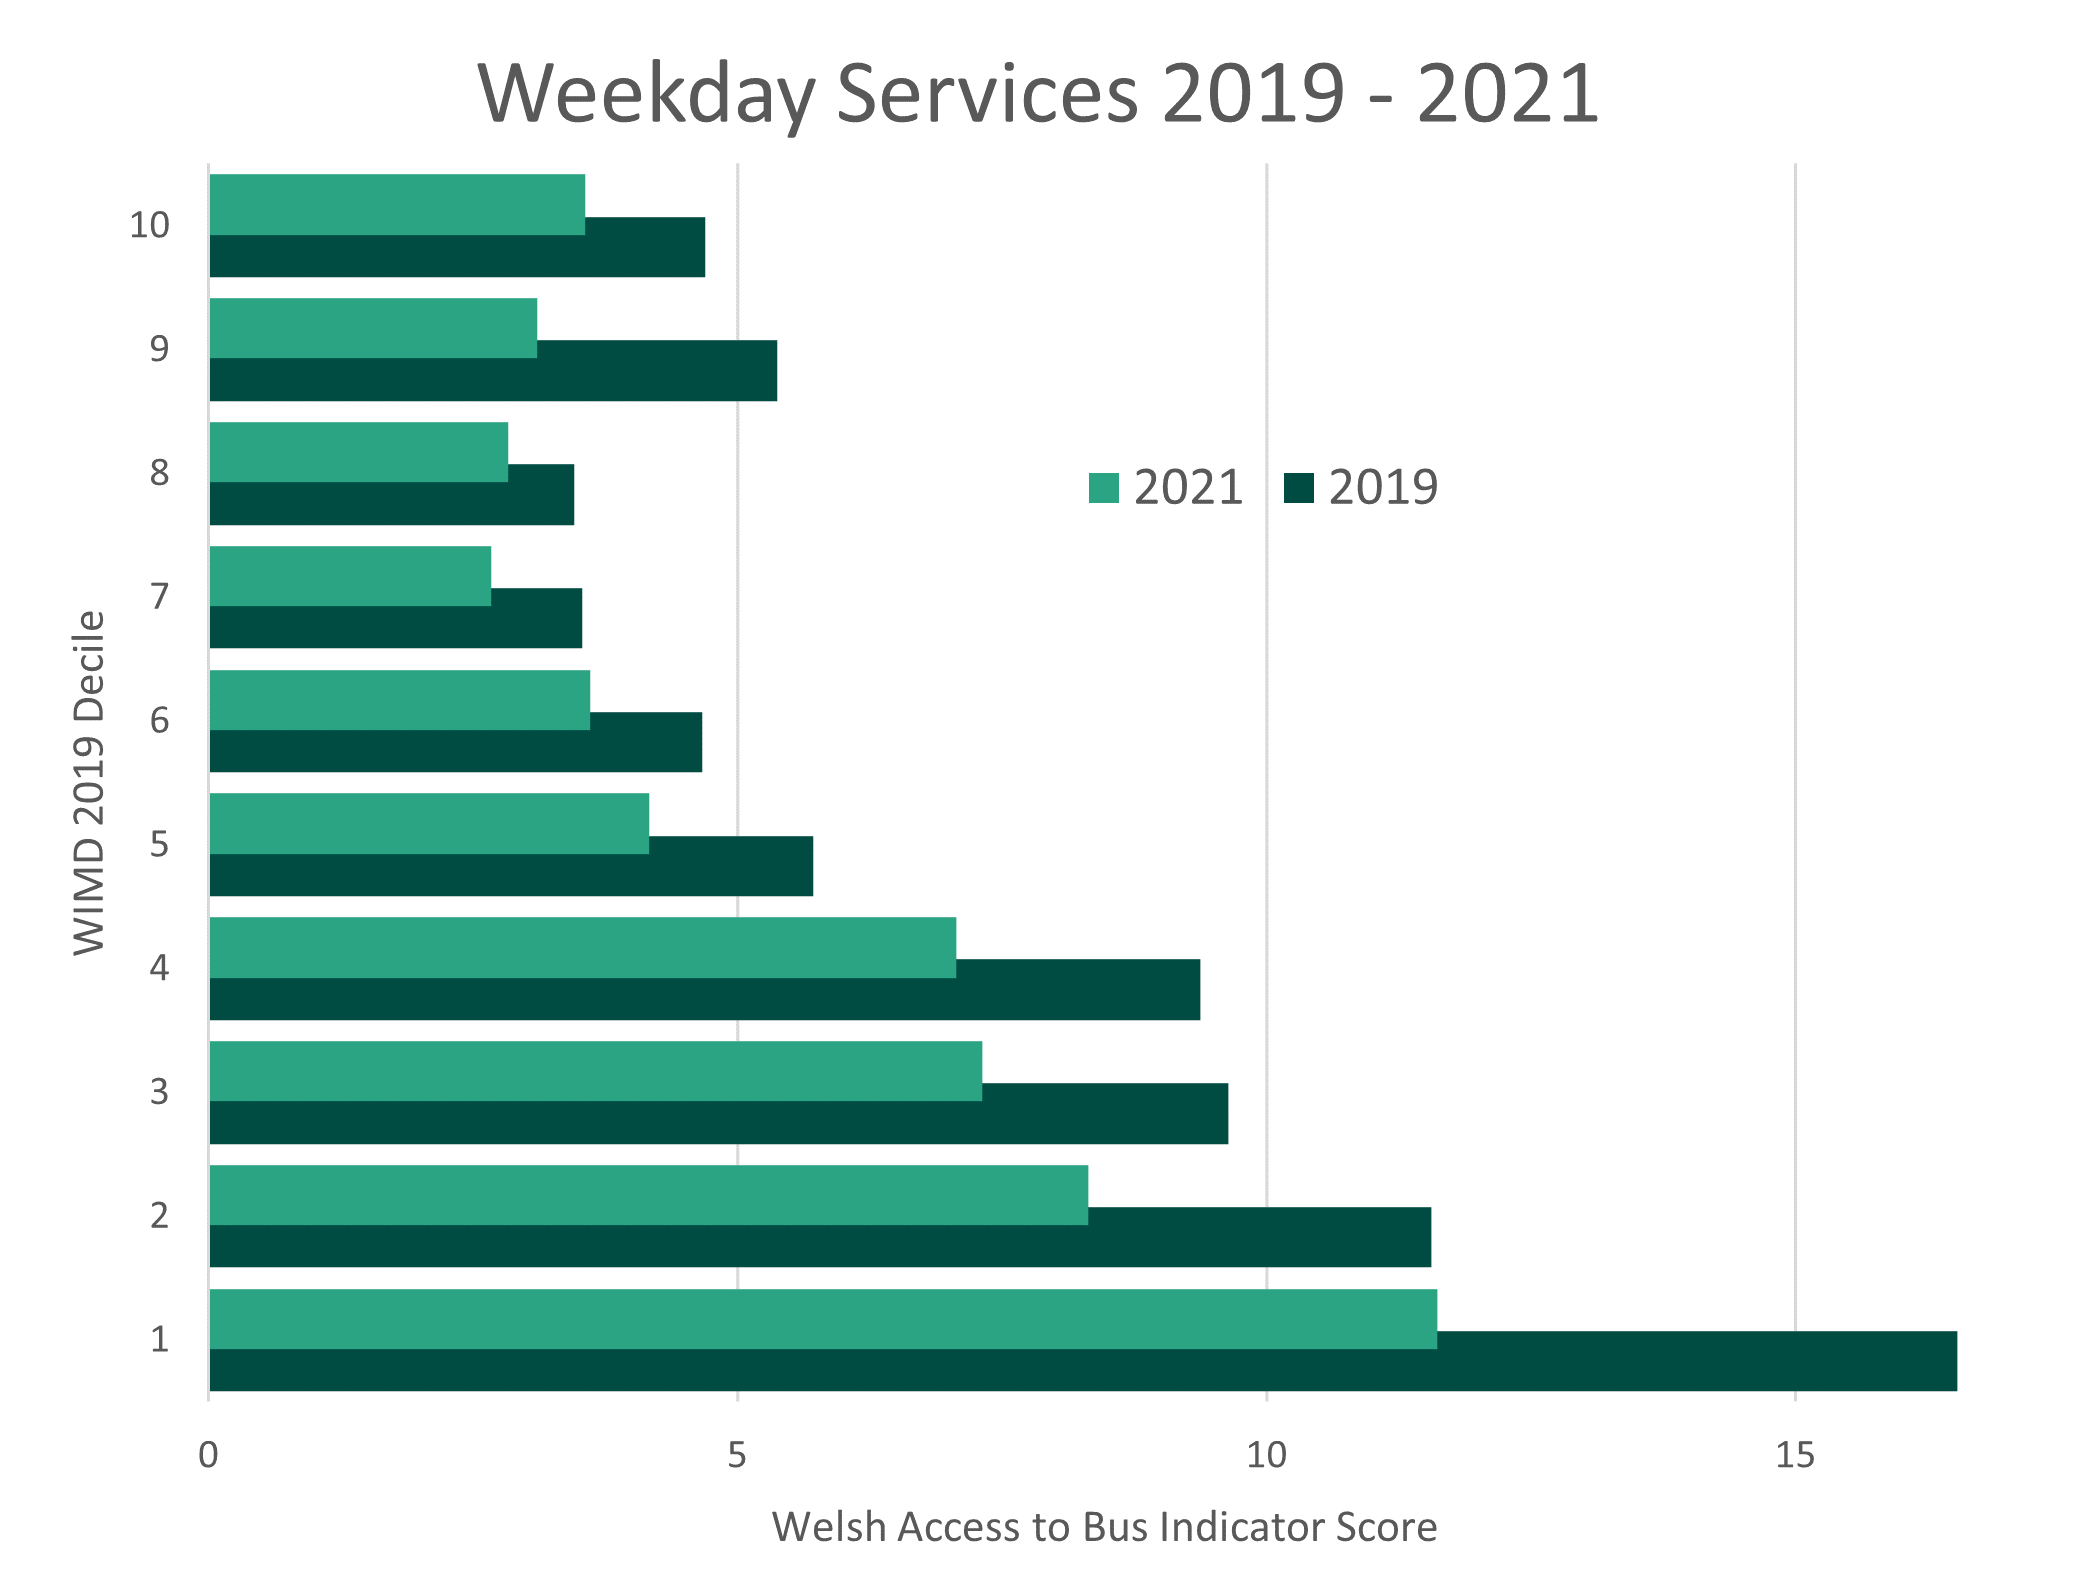
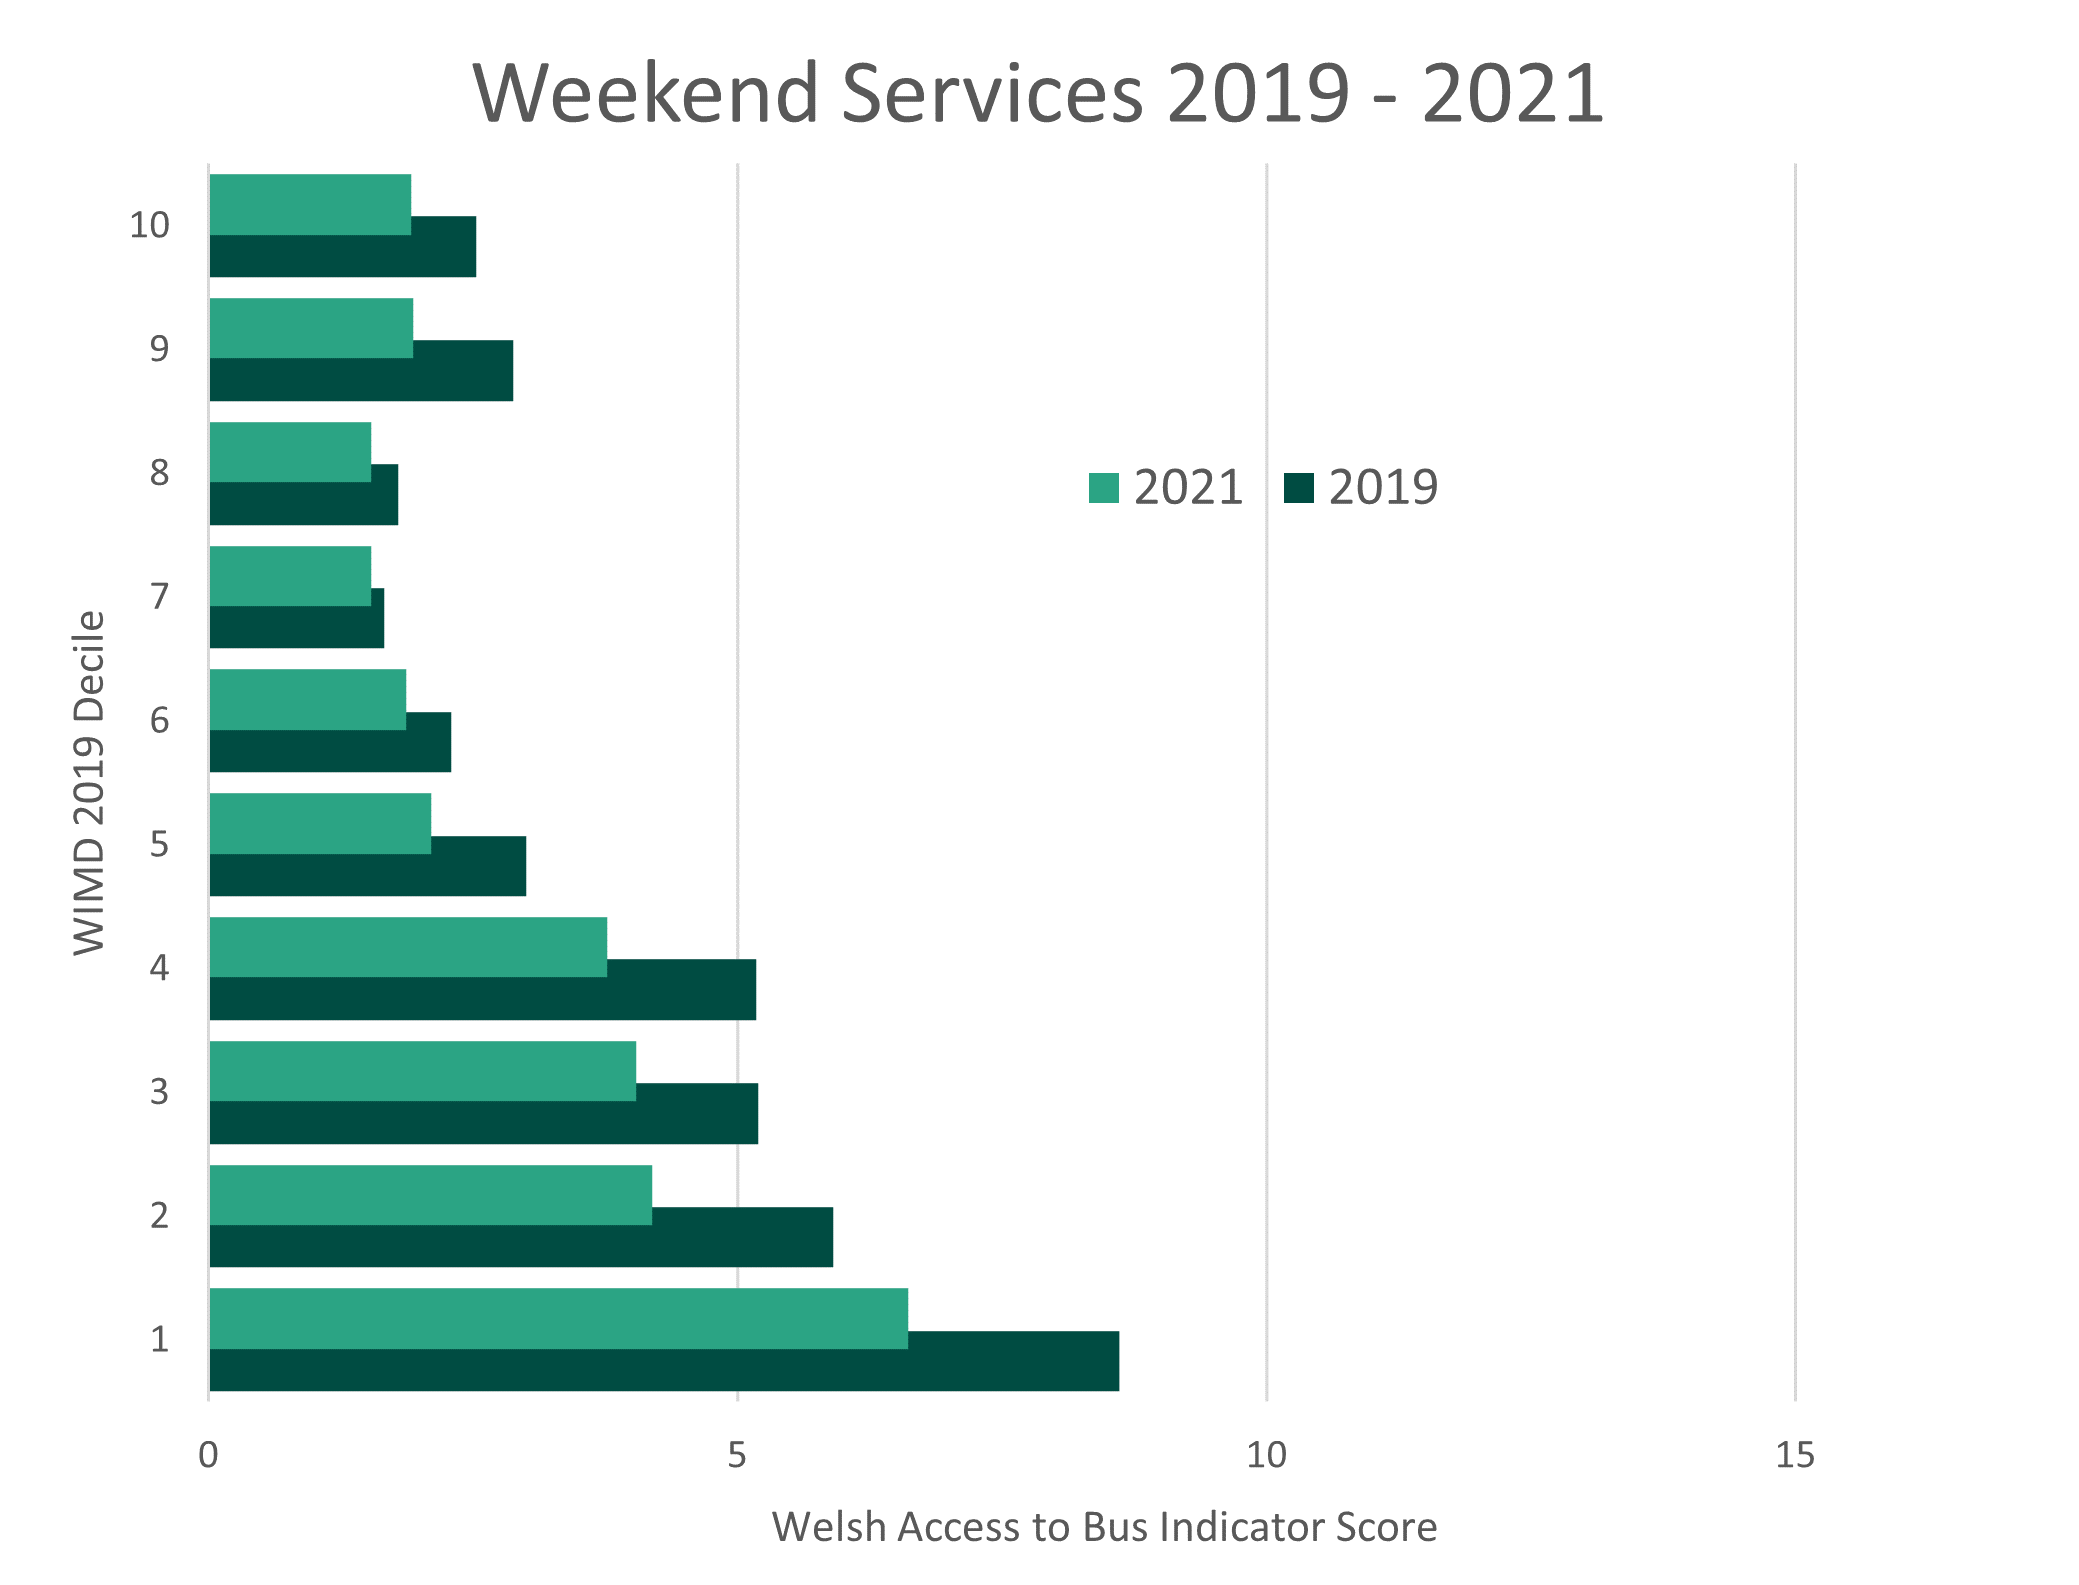
Declines were largest amongst the most deprived areas of Wales, suggesting they experienced the greatest loss of bus services on this metric over this timeframe (Figure 3). While a decline was experienced in every decile, magnitudes reduced consistently until the 9th decile. The larger loss experienced in decile 9 implies that some of the least deprived areas also experienced reductions in bus services. This could be because these LSOAs are in suburbs of urban areas which experienced some of the largest reduction in services. Broadly the same profile was evident for weekday and weekend services.
Addressing inequalities in public transport in scrutiny and policy
Loss of provision has a knock-on effect for everyone living in the affected areas, but particularly those dependent on public transport for access to, for example, retail and health services and to social and family contacts. Recovery of bus services has been identified as an important concern for Welsh transport policy development.
We will undertake follow up analysis, aiming to monitor how far public bus services have recovered since August 2021, or whether pandemic-influenced reductions have persisted longer term.
We hope our work can inform the Senedd’s Climate Change, Environment and Infrastructure’s current work on the future of public transport. The analyses could also support attempts to promote joined-up approaches between public transport service providers and the provision of, for example, health, retailing and employment opportunities as advocated in the Welsh Government's 'Llwybr Newydd' Transport Strategy.
Unless sufficient bus services are available to those who need them most the ambitious modal shift targets set out in Llwybr Newydd will be difficult to achieve. So the need to identify and address transport inequalities is likely to form a key theme in upcoming regional and national transport plans. It will also be essential to the success of Welsh Government plans for bus reform, as set out in the recent White Paper , and also in the National Bus Strategy for Wales. Such an approach could also be used to help inform on-going debates concerning climate change and the need to promote active travel alternatives.
Article by Dr Mitchel Langford (WISERD co-director), Professor Gary Higgs (WISERD co-director) and Dr Andrew Price, WISERD, University of South Wales
