


The Coronavirus pandemic is accelerating changes in how we pay for goods and services. The number of facilities providing access to cash is decreasing as bank branches and ATMs continue to close. Media reports also discuss increases to contactless limits and some businesses refusing to take cash payments.
A recent inquiry into access to banking by the Senedd’s Economy, Infrastructure and Skills (EIS) Committee examined the declining provision of banks, building societies and ATMs. The Committee called for the Welsh Government to protect and improve access to cash and to:
… properly map the gaps in banking services overall – access to banks, Post Offices, free-to-use ATMs and connectivity for digital banking.
The Welsh Government accepted this recommendation in principle stating that it would require a multi stakeholder approach.
The changing geographical pattern of retail banking
Under Senedd Research’s Academic Fellowship Scheme, Associate Professor Mitchel Langford from the University of South Wales explored how the latest digital mapping technologies can lead to a better understanding of the geographical provision of retail banking. The full report Exploring geographical patterns in the changing landscape of retail banking services in Wales (PDF, 3.09 MB) is published as a Wales Institute of Social and Economic Research and Data (WISERD) research paper with accompanying maps.
Traditional methods for measuring service provision
The research highlights the limitations of traditional methods of analysis when considering the decline of branch provision. The two methods traditionally used are ‘network distance’ and the ‘container method’.
Network distance reports travel distance between a population centre and its nearest bank or building society. These maps shows that whilst average travel distance increased from 2.8km in 2008 to 3.8 km in 2018, the largest increases appear to be concentrated in rural communities.
Travel distance to nearest branch, and increased distance by constituency, 2008-2018.
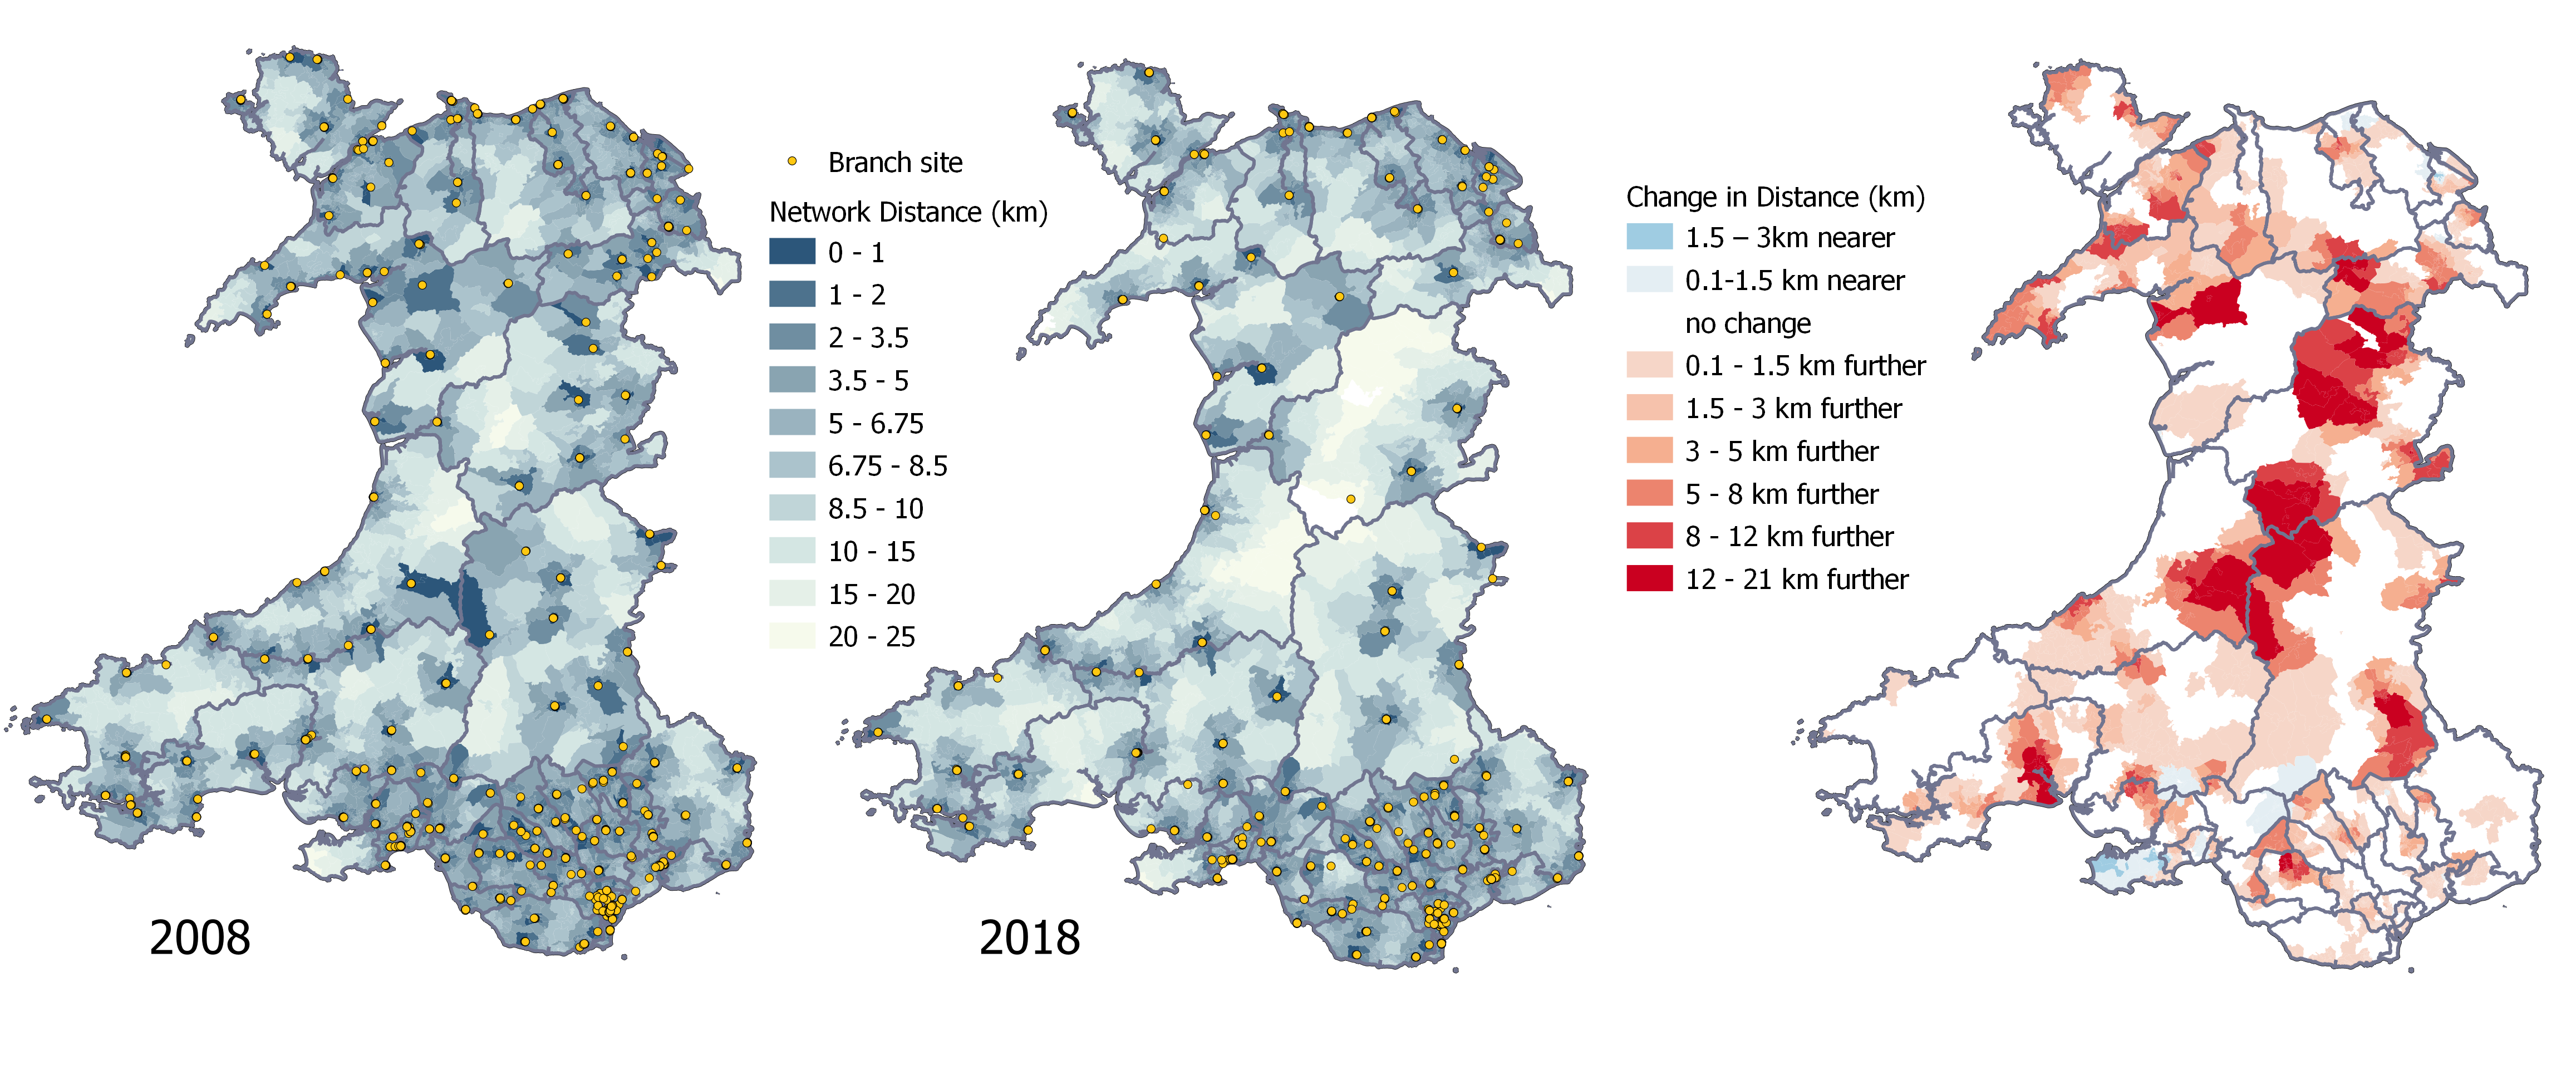
Network distance is simple and intuitive but doesn’t take account of the balance of supply to demand in a local area. This can prevent it from identifying areas of relatively poor access in urban areas, where branches may be physically close but are shared amongst a large local population.
The container method reports the supply-demand balance in a defined area by dividing the number of branches in the area by its population. It’s often used to evaluate accessibility for administrative areas such as local authorities and Senedd constituencies. It doesn’t take account of the actual travel distances needed to reach branches.
Supply-demand scores calculated using the container method for constituencies.
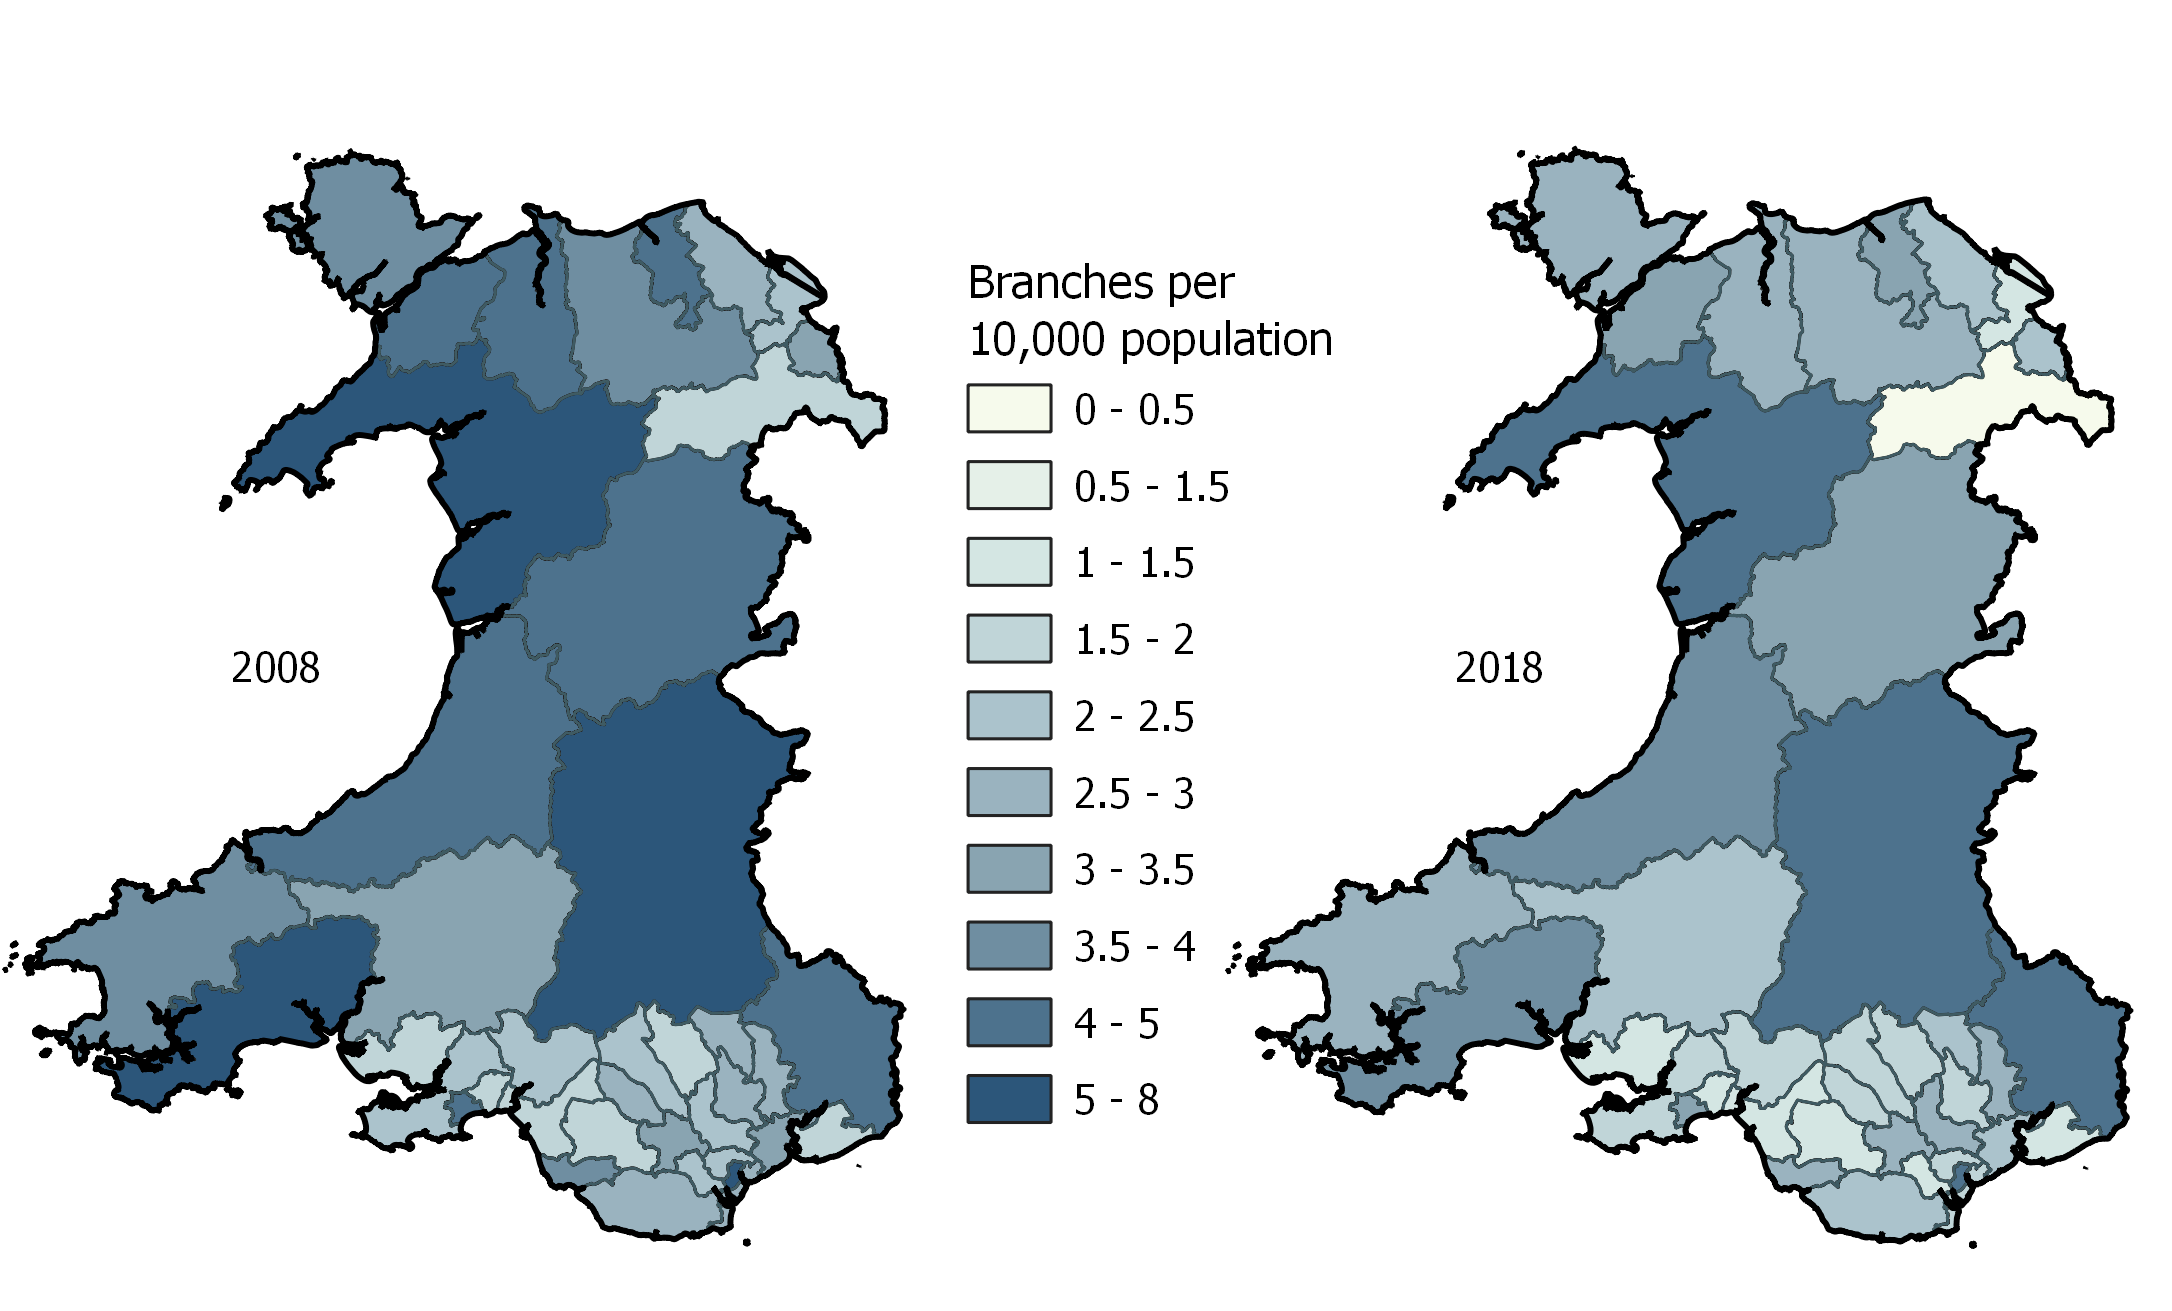
In 2008 there were 791 bank and building society branches in Wales serving an adult population of 2,466,956, which is an average of 3.2 branches per 10,000 residents. By 2018 branch closures had reduced the number of sites to 532, and this nationwide ratio fell to 2.4 branches per 10,000 residents.
Mapping the ratio in each constituency in 2008 and 2018, and change in these scores, again illustrates how decline varies geographically amongst local regions
Enhanced two-step floating catchment area method
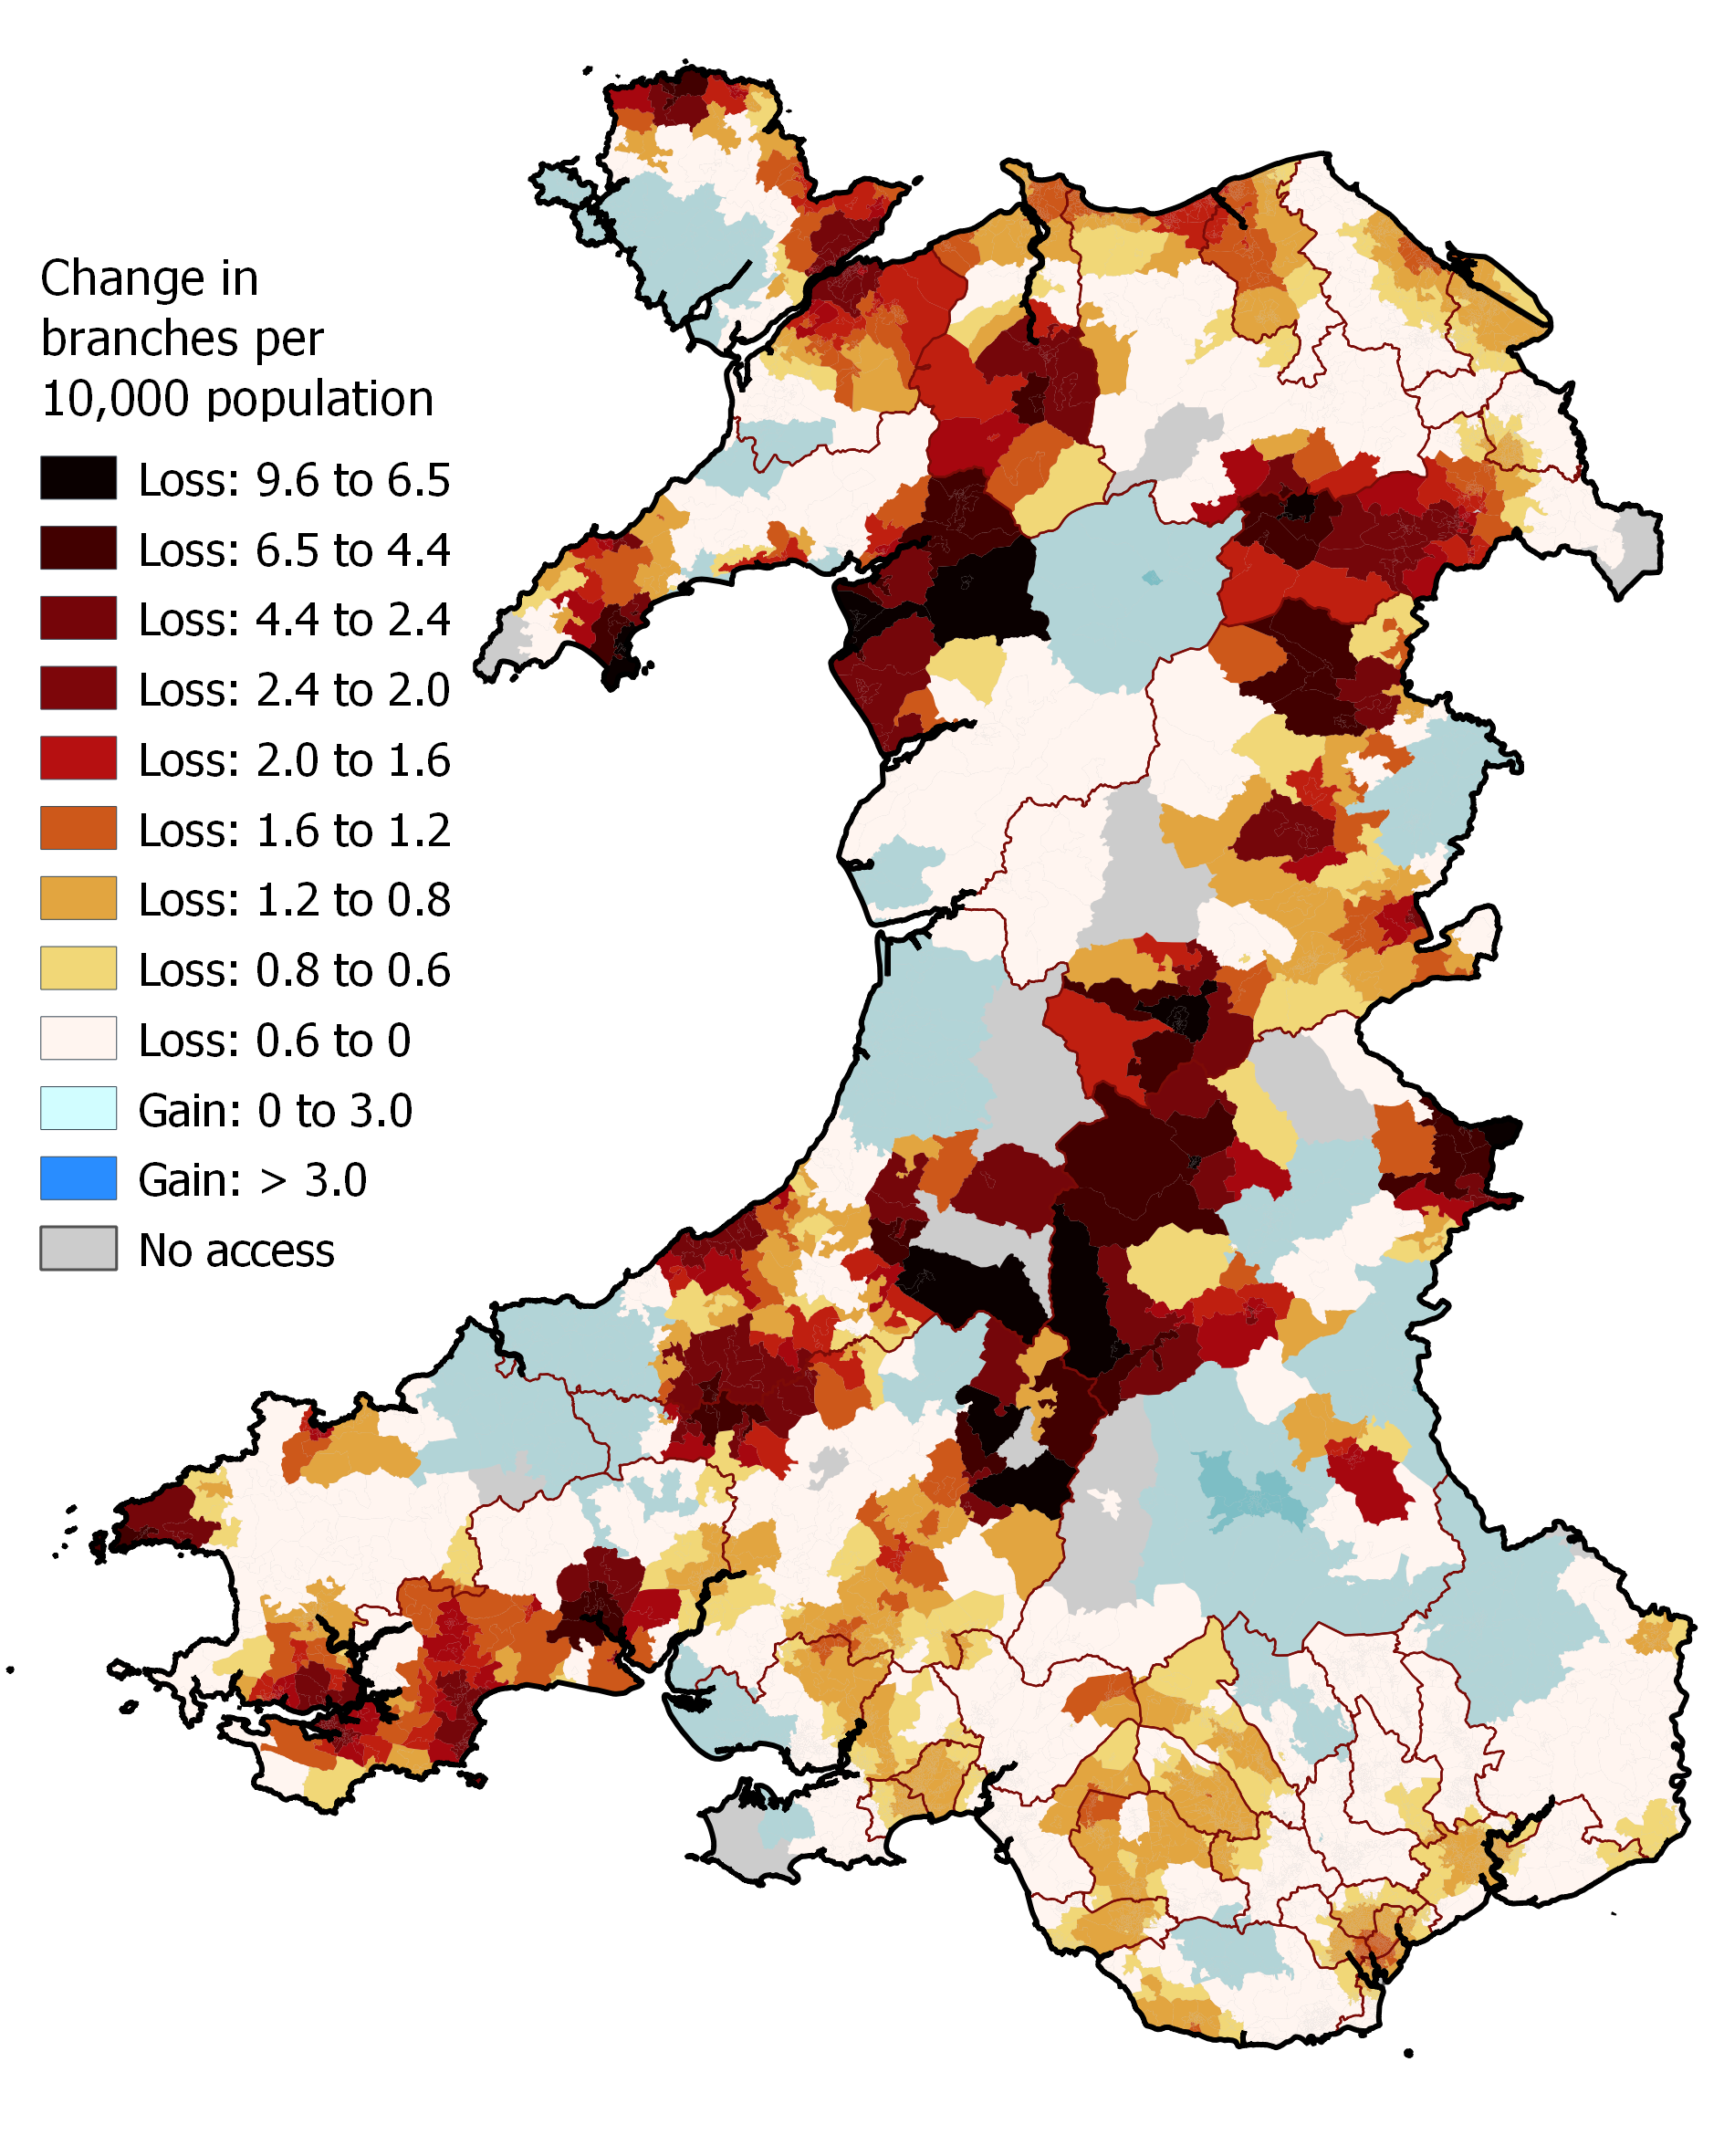
The research advocates using an advanced mapping technique called ‘enhanced two-step floating catchment area’ (E2SFCA). This can map accessibility to services at a more granular level than the traditional methods. Details on how it’s computed can be read in the full research paper.
Like the container method, E2SFCA maps the number of branches per head of population. However, estimates are based on a more realistic model of consumer behaviour where residents can use any branch found within a specified travel tolerance. They’re not restrained to using branches within local administrative boundaries. The map below shows changes in accessibility between 2008 and 2018 reported by E2SFCA at Output Area level.
Changes in accessibility based on E2SFCA
The research uses the same E2SFCA methodology to examine access to Post Offices and free-to-use ATMs. It also considered journeys made by bus, and so provided estimates of accessibility to banking services for those who rely on this form of public transport.
How could this research be used in the future?
These models can also be used to examine future scenarios. For example, if a local branch were to close, how much further must residents travel to reach another branch of the same brand? Or what might be the potential impacts of withdrawing or introducing a new bus route?
The research was conducted during the Coronavirus pandemic using datasets that pre-dated its onset. The full impacts of the pandemic on future branch provision, on societal shifts in the way financial dealings are conducted, or on the uptake of digital banking and cashless transactions, have all yet to manifest themselves. The information gathered and presented in this research will act as a valuable benchmark against which to evaluate such issues of concern in the future.
Article by Mitchel Langford (University of South Wales) and Helen Jones (Senedd Research, Welsh Parliament)
