


Article by Jonathan Baxter, National Assembly for Wales Research Service
Hardly a day goes by without data on house prices hitting the headlines and these statistics often appear to be at odds with each other. Nationwide and Halifax both produce house price indices based on their own mortgage completions, but this blog post focuses on the Land Registry index, which is generally considered to be the most comprehensive as it covers the whole market. Is there a housing bubble? It depends on which figures you look at, but probably not for most people in Wales, or indeed many other parts of the country according to Land Registry data. In June, the UK Government’s Communities Secretary, Eric Pickles, suggested that any bubbles were in people’s imagination. Not everyone agrees though, not even all of his cabinet colleagues. House prices in London are soaring, rising by almost 19 per cent year-on-year according to data released by the Land Registry. The average home in London will now set you back around £440,000, that’s almost four times as much as the £117,000 that you will need for the typical Welsh home. The same data shows that Wales is leading the way, not in terms of rising prices, but rather falling prices. The average home in Merthyr now costs just over £60,000, 13.2% less than it did a year ago. The fall in Merthyr was the biggest of any in England and Wales. The second biggest decline was experienced by Blaenau Gwent which saw a fall of over 10%. However, it’s worth noting that both of these areas traditionally have very low numbers of sales. Contrast Merthyr and Blaenau Gwent to the up-and-coming area of Walthamstow (which sits within the borough of Waltham Forest) in north-east London. House prices there have risen by 26.3% in a year, a higher rate than any other area of England and Wales. The average home in Waltham Forest will now cost you £327,784. The fastest rising house prices in Wales were on Anglesey, which saw a more modest 8.5% increase and an average price of around £135,000. Of course, you could make the same comparisons between London and many other parts of England or Wales; prices in the north-east of England rose by a meagre 0.9%, which is even less than the 2.3% average experienced across Wales. What the statistics show is there are two housing markets: one in London and the south-east of England and another in the rest of the country. Why are house prices in parts of London and south-east England rising so rapidly? There are a range of factors, but an acute shortage of housing supply appears to be the most influential. Bank of England Governor Mark Carney highlighted that his native Canada, with half the population of the UK, builds twice as many homes as the UK each year. Concerns about rising prices in London and the south-east of England, and implications for the rest of the country, have been voiced by economists, with the International Monetary Fund (IMF) noting “particularly high house price inflation in London”, which “is becoming more widespread”. However, while the IMF doesn’t think that an annual increase approaching 20% is a “credit led bubble” it does highlight high loan-to-income ratios as a potential risk should either borrowers’ incomes or interest rates change. The Bank of England can’t address the policy obstacles affecting house building, for example planning issues are a matter for the Welsh Government. What it can do, through its Financial Policy Committee (FPC), which was set up in the wake of the banking crisis in 2007-08, is take steps to control the high loan-to-income ratios highlighted by the IMF as a risk to the economy, ratios that Mr Carney agreed had “increased markedly over the past year to a record high”. The FPC has now announced that lenders will have to undertake two new tests: an affordability test to see whether borrowers could still afford their mortgage if interest rates were 3% higher, something that many “prudent lenders”, as Mr Carney put it, have already been doing. The second new condition is that no more than 15% of a lender’s new residential borrowers can be at loan-to income ratios of greater than 4.5. Perhaps surprisingly, Mr Carney thinks these changes will only have “minimal impact” on the UK market as a whole. However, the measures aren’t intended to have an immediate impact, but are actually more akin to an insurance policy; they aim to protect the economy in several years time when interest rates are likely to be significantly higher than the current 0.5%, and house prices may well be higher. The new condition limiting a bank’s exposure to high loan-to-income mortgages doesn’t stop individual loans being made at more than 4.5 times a borrowers income, it’s just the number of these loans issued that could be affected. There’s an interactive map showing historical house price to income ratios for England here and the Research Service has produced the maps below to show how income to house price ratios have changed in Wales over the first 15 years of devolution. 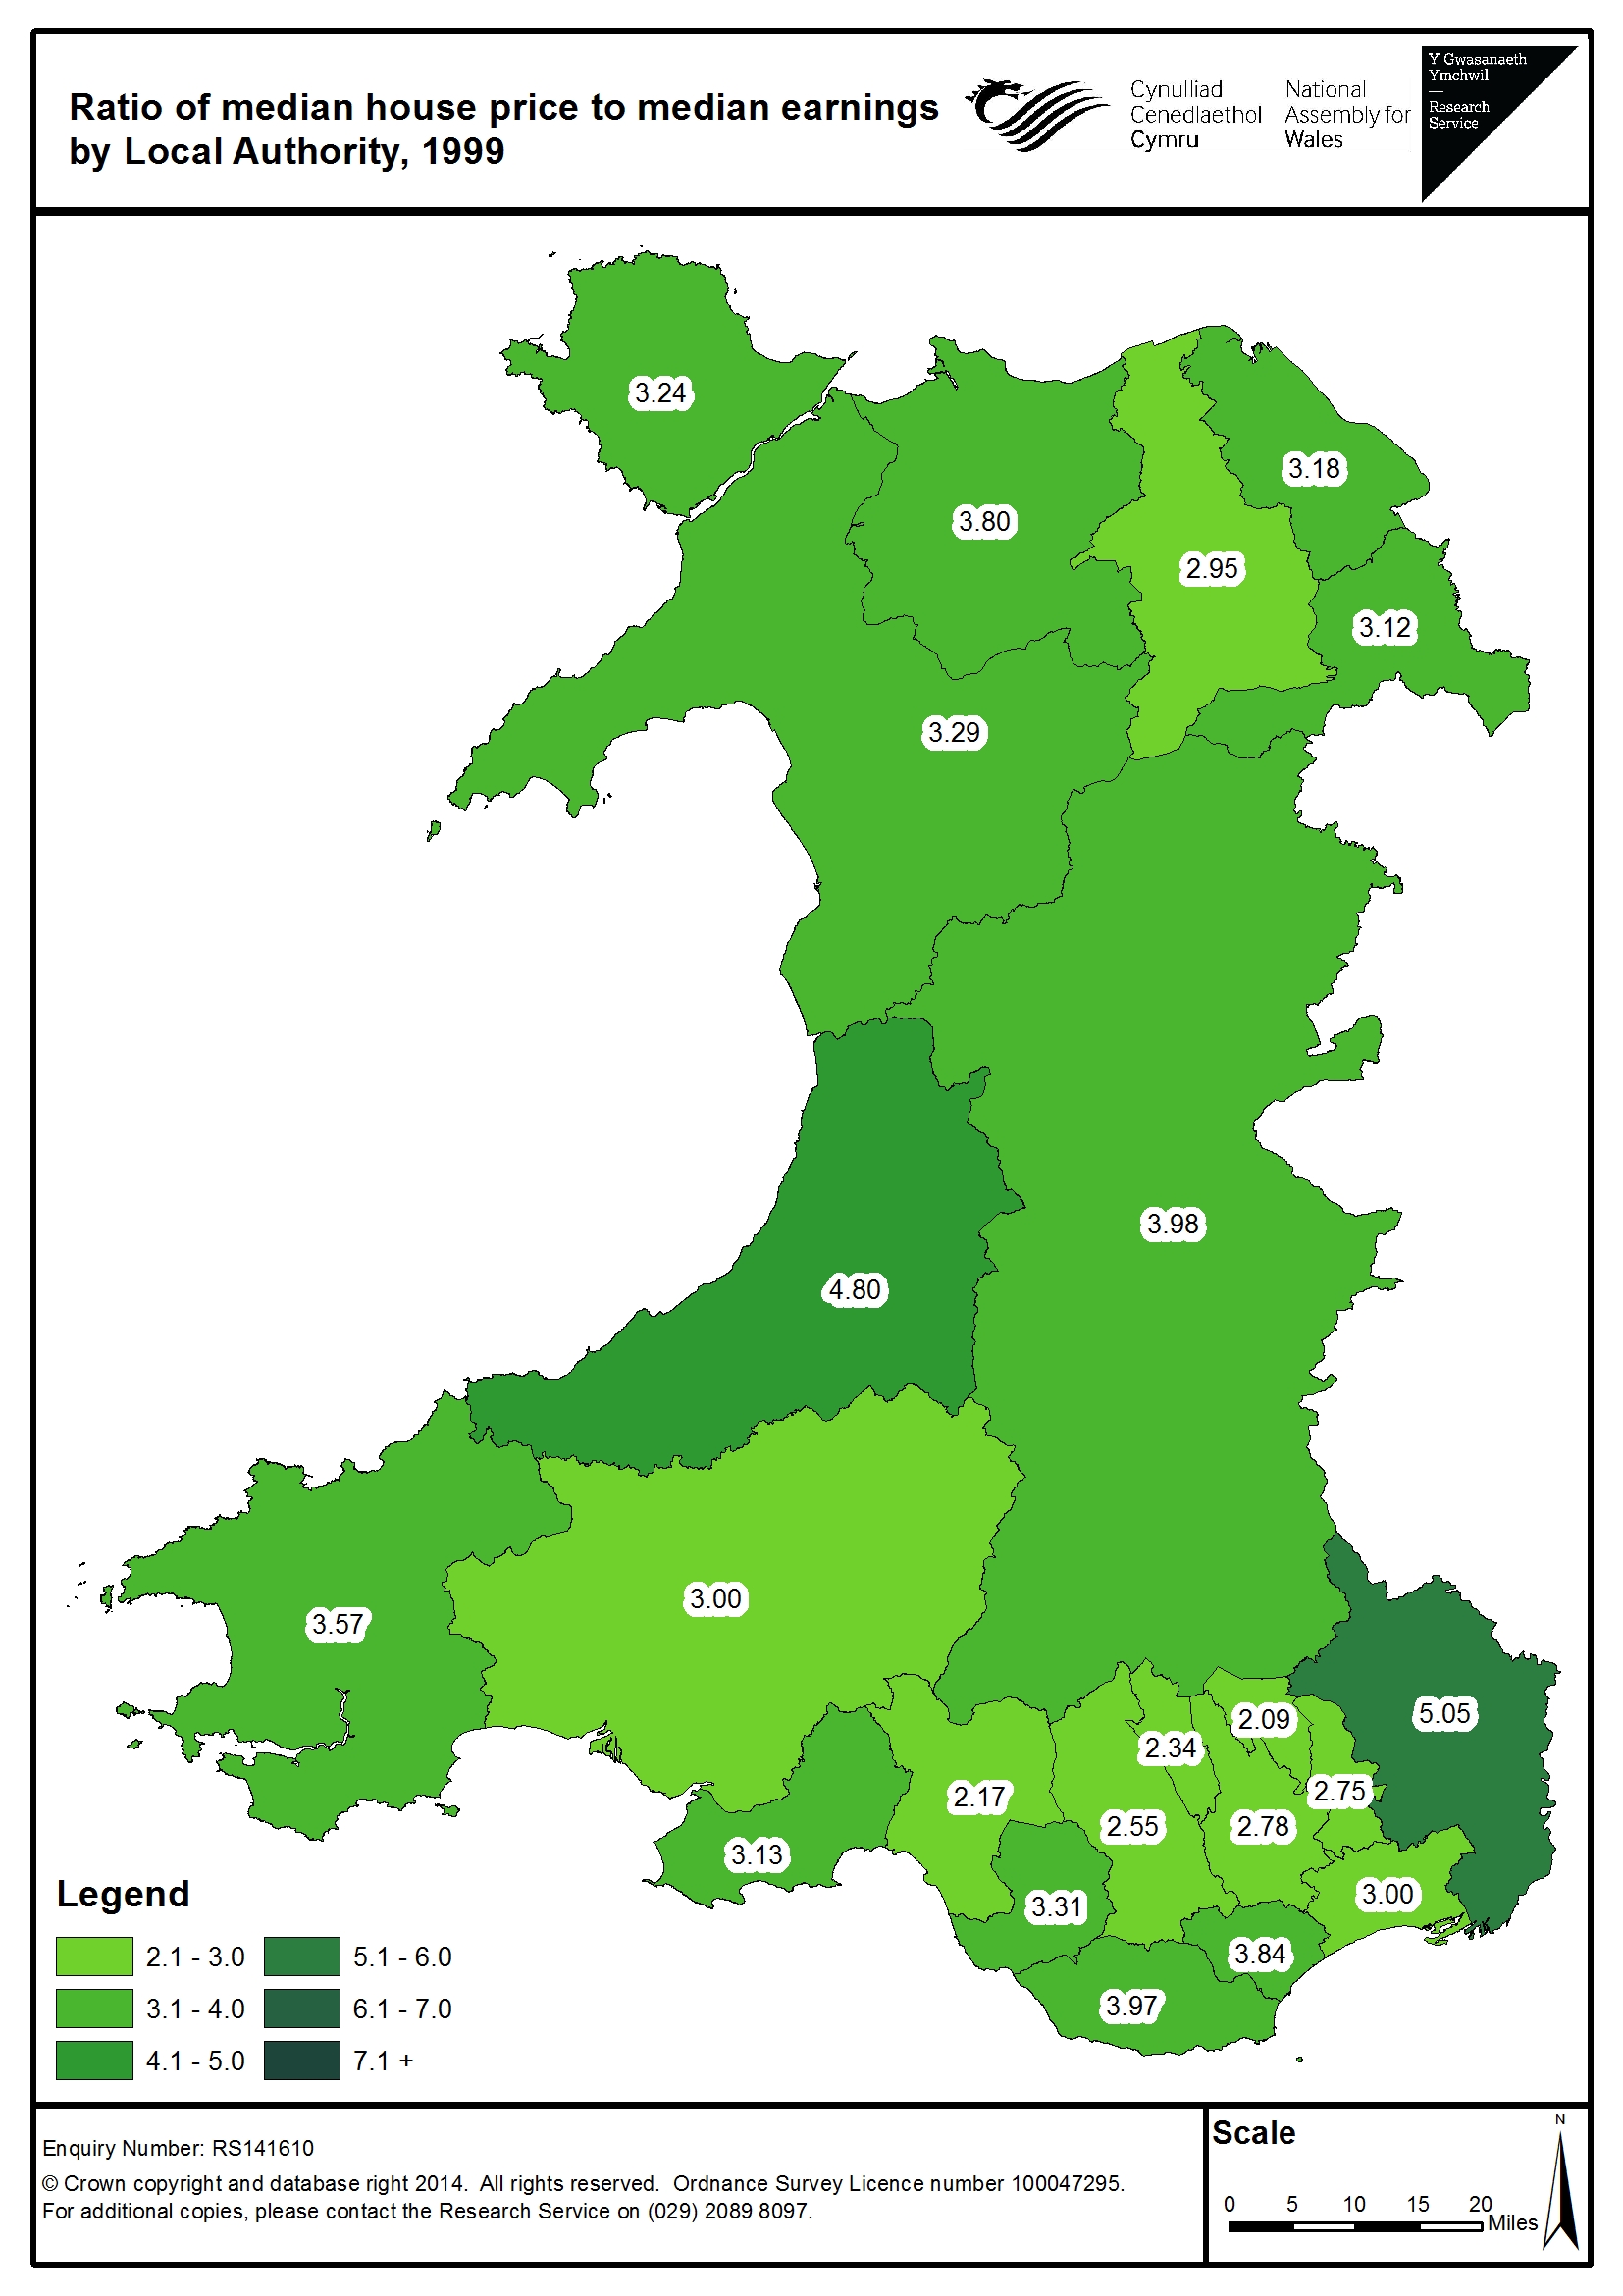
 Of course, these types of maps don’t tell the whole story, and certainly don’t mean that particular parts of the country are unaffordable. They show price-to-income, not loan-to-income ratios and don’t account for any deposit. Neither do they take account of households with more than one income. What they do show is that home ownership has become more costly, markedly so in many areas. Politicians, economists and, perhaps most importantly, borrowers will all be watching to see how the market develops over the next few months and how it responds to the long-predicted rise in interest rates later this year.