

Senedd Research stops publishing new research and analysis during the pre-election period, from 7 April to 6 May. This article won’t be updated during this time. You can find links to the most recent data and information in our Coronavirus (COVID-19) signposting article.
This blog post explains how and when data is published regarding COVID-19 cases and deaths in Wales. The World Health Organization (WHO) defines COVID-19 as the infectious disease caused by the coronavirus. We’ve included summary charts which will be updated weekly and may be revised as the data published by Public Health Wales (PHW) change. Data for the most recent two or three days have been omitted as they are likely to change substantially as more cases, tests and deaths are reported.
COVID-19 statistics are published by PHW every day on its dashboard. PHW publishes data on the number of testing episodes, confirmed cases and deaths, along with data on hospital admissions, GP respiratory consultations, NHS Direct and 111 calls, and schools surveillance. PHW cautions that all the data published on its dashboard are provisional and will be subject to future revision.
Testing episodes and confirmed cases
PHW explains that individuals may be tested more than once for COVID-19. In its testing data PHW uses 6-week periods where if an individual is tested more than once within that 6-week period they are only counted once. If any test results are positive then this result is published as a confirmed case. Testing data are published by local authority of residence and are also broken down by sex and age for Wales. The Welsh Government also publish weekly testing data for coronavirus (COVID-19). Read our blog post on NHS Wales Test, Trace, Protect programme: how it works to find out more.
PHW states on its dashboard that its testing data excludes cases confirmed in Wales, but resident elsewhere, and those where a location of residence could not be determined.
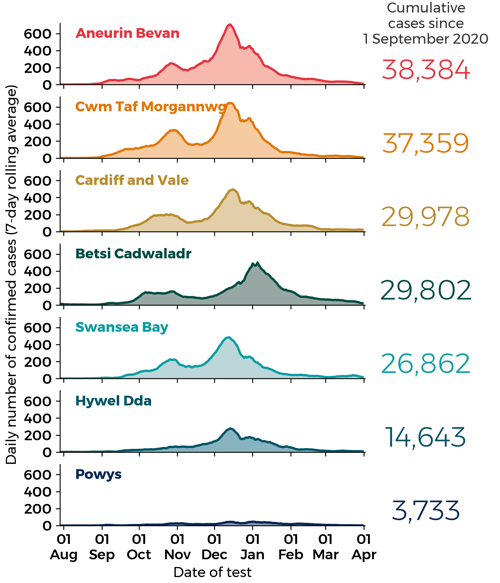
Cumulative number of confirmed COVID-19 cases since 01 September per 100,000 resident population
The graphs below show the daily number of new confirmed cases of COVID-19 by Local Health Board. A seven-day rolling average smooths the data to show the broader trend. The shaded area beneath each curve approximately corresponds to the cumulative number of cases. These are shown to the right of each graph for the most recent available data. Cases have increased since June when Wales moved to mass testing.
Daily confirmed cases of COVID-19 by date and Local Health Board
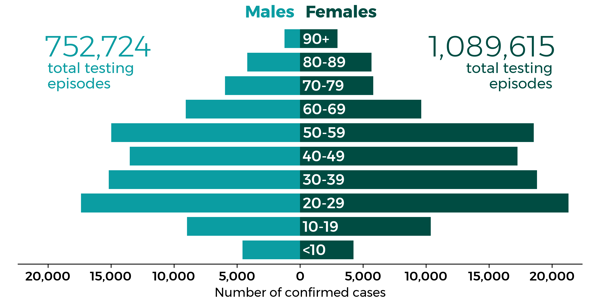
Number of confirmed cases of COVID-19 in Wales by age and sex
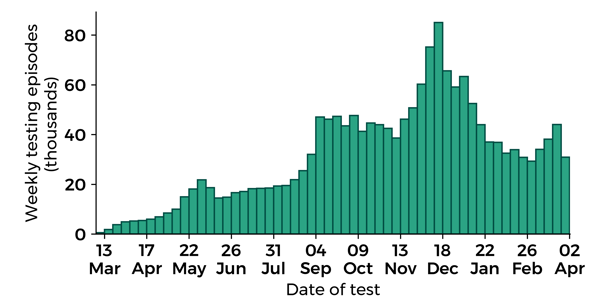
The graph below shows the weekly number of new testing episodes in Wales.
New testing episodes in Wales
Deaths and confirmed cases of COVID-19
PHW publishes the number of deaths suspected to be caused by COVID-19 in people who have tested positive. In the graph below, the dark-green curve shows a seven-day rolling average of these numbers. For comparison, the light-blue curve shows a seven-day rolling average of the daily number of new confirmed cases of COVID-19.
Daily deaths and daily confirmed new cases in Wales
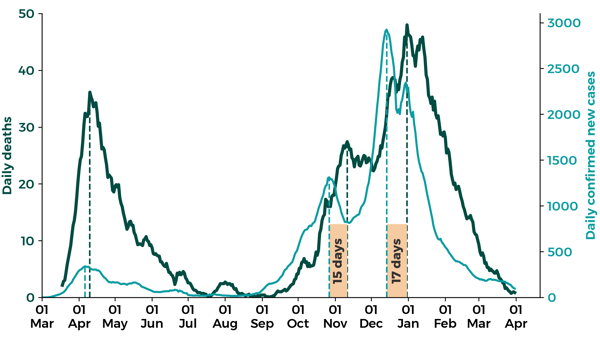
The dashed lines indicate the major peaks in confirmed cases and deaths suspected to be caused by COVID-19. The two major peaks in cases that occurred in October and December were followed by peaks in deaths 15 and 17 days later. There has been an overall decrease in cases since the middle of December.
During the first wave of the pandemic, the delay between peaks was about 4 days. A shorter delay compared to the second wave could be due to an increased rate of testing and people getting tested more routinely and at an earlier stage of their symptoms.
In relation to the data above, PHW states:
Our deaths figures include any report to PHW of a death in a hospitalised patient or care home resident where COVID-19 has been confirmed with a positive laboratory test and the clinician suspects this was a causative factor in the death. Deaths occurring in other settings or where there was not a confirmed laboratory result are not included, however they are factored into the statistics reported by ONS using data available on completion of the death registration process. The newly reported deaths figure may include deaths reported retrospectively to PHW, and therefore may be higher than the true recent increase.
Other sources of data
The Office for National Statistics (ONS) publishes suspected and confirmed COVID-19 deaths in England and Wales in a weekly publication – Deaths registered weekly in England and Wales, provisional. This publication uses data made available after the death registration process and is therefore lagged by over a week. The latest data are analysed in our blog post Coronavirus: registered deaths.
The Welsh Government publishes a range of data and analyses on the effect of coronavirus on society in Wales. This webpage includes data on businesses and the economy, attendance at local authority education settings, NHS activity and capacity, shielding, testing and housing.
Public Health England publishes its data in a dashboard and the Scottish Government publishes daily statistics on its website with National Records of Scotland publishing a weekly update. The Department of Health in Northern Ireland publishes daily statistics on its dashboard. The World Health Organization (WHO) also has a dashboard showing confirmed cases and deaths around the world.
Article by Joe Wilkes and Helen Jones, Senedd Research, Welsh Parliament