Have official statistics started to reflect the impact of coronavirus on the labour market?
Each month the Office for National Statistics (ONS) publishes estimates of employment and unemployment rates. These estimates are based on information collected by the Labour Force Survey (LFS) for the preceding three-month period. The time lag to these figures means that the latest labour market release published on 14 December 2021 provides information from August 2021 to October 2021.
The Coronavirus Job Retention Scheme ended on 30 September 2021. However the November LFS figures do not reflect the number of people who have been placed on furlough due to coronavirus.
The latest HMRC statistics on the Coronavirus Job Retention Scheme (CJRS) show 39,700 employments in Wales have been furloughed as at 30 September 2021. This represents a take up rate of 3%. 18,500 females and 21,200 males were furloughed under the CJRS in Wales as at 30 September 2021.
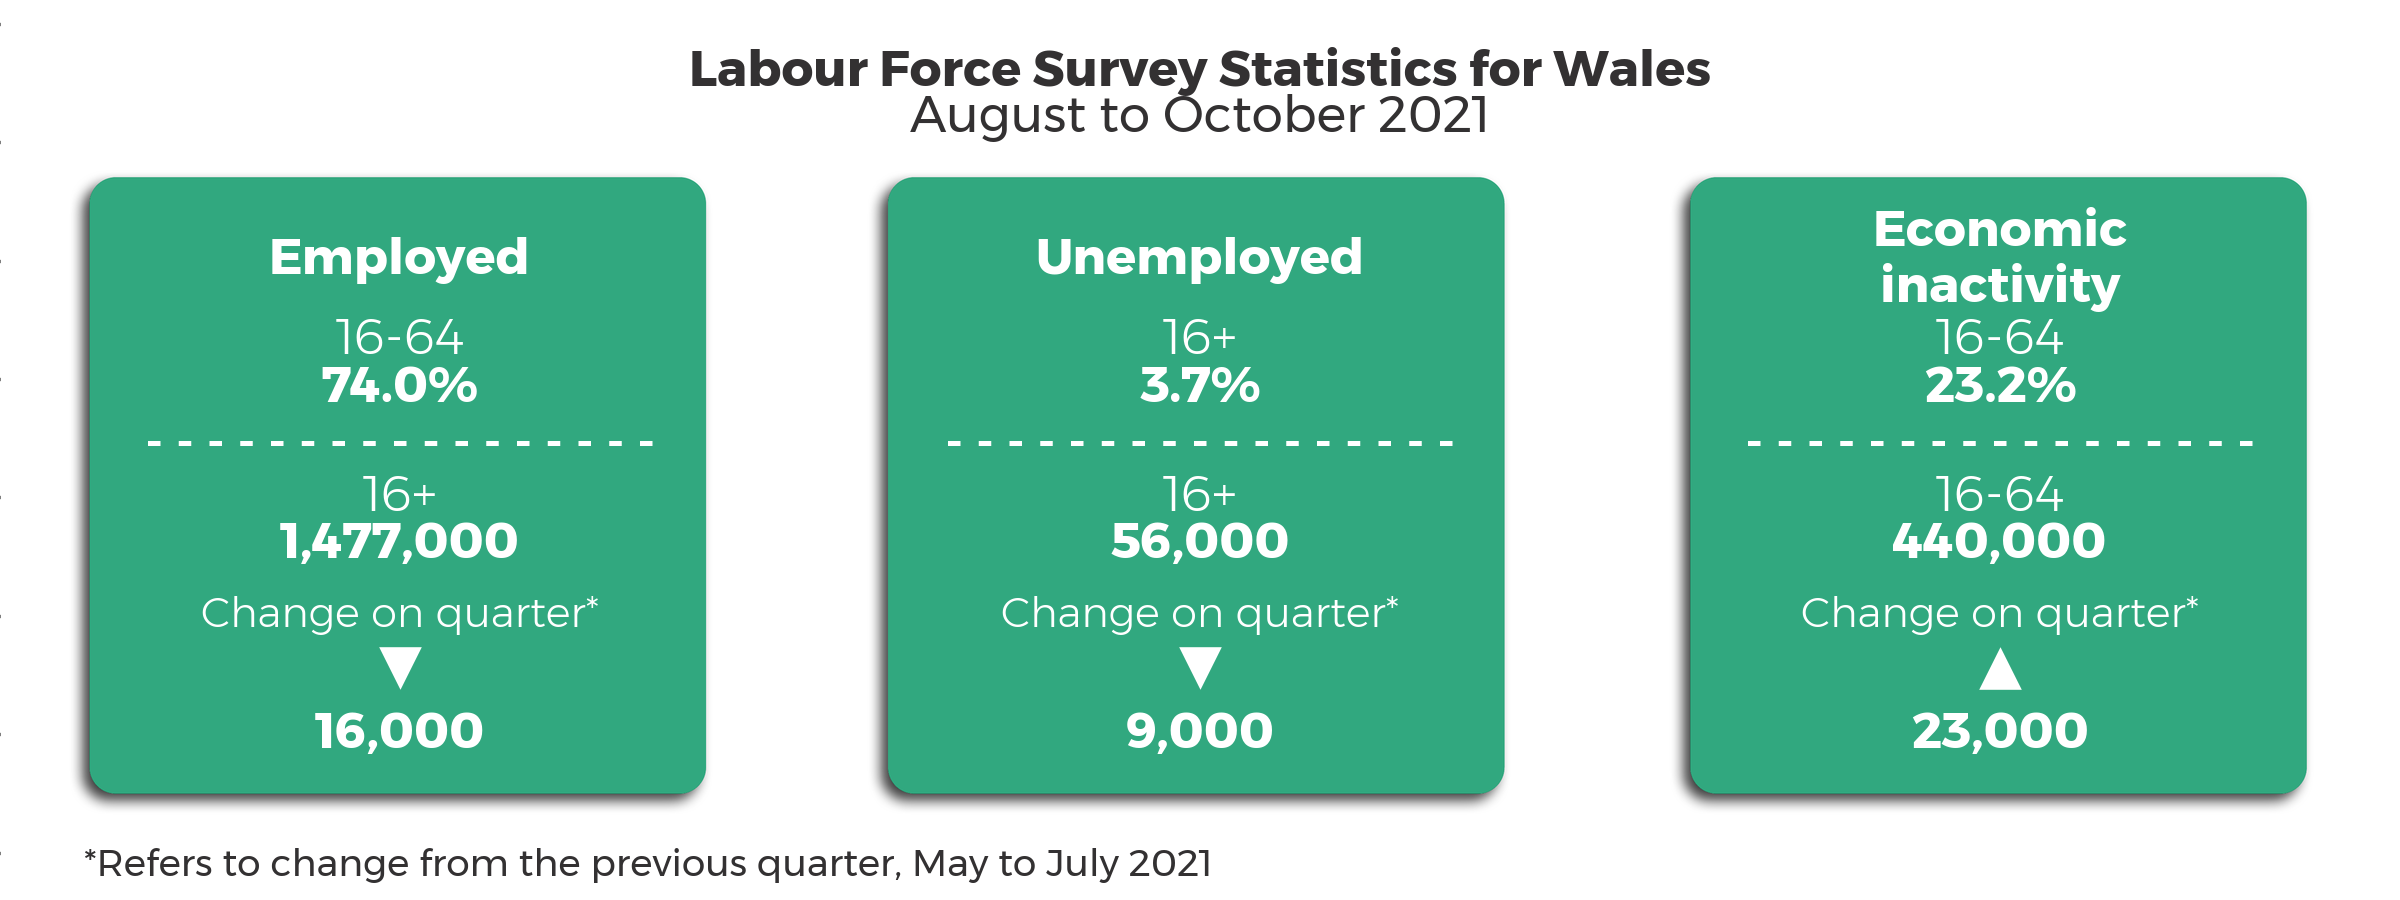
What do the latest Labour Force Survey figures show?
The Labour Force Survey (LFS) is a quarterly household survey of around 80,000 adults. The survey asks a range of questions on employment and the labour market. As people were still furloughed during part of the latest reporting period (August 2021 to October 2021) the LFS doesn’t yet reflect the full impact of coronavirus on the labour market in Wales.
ONS explains they have made changes to the LFS:
Labour Force Survey (LFS) responses have been reweighted to new populations derived using growth rates from HM Revenue and Customs (HMRC) Real Time Information (RTI), to allow for different trends during the coronavirus (COVID-19) pandemic. The reweighting will give improved estimates of both rates and levels.
For August to October 2021 the unemployment rate for people aged 16+ in Wales was 3.7%, lower than 4.2% in the previous quarter (May 2021 to July 2021). This is a decrease of 9,000 people from the previous quarter to 56,000.
Source: ONS, Regional labour market: Headline indicators for Wales
The unemployment rate in Wales (3.7%) is higher than Northern Ireland (3.6%) but lower than England (4.3%) and Scotland (4.1%).
Percentage of people aged 16+ who are unemployed, UK nations; August 2016 – October 2016 to August 2021 - October 2021.
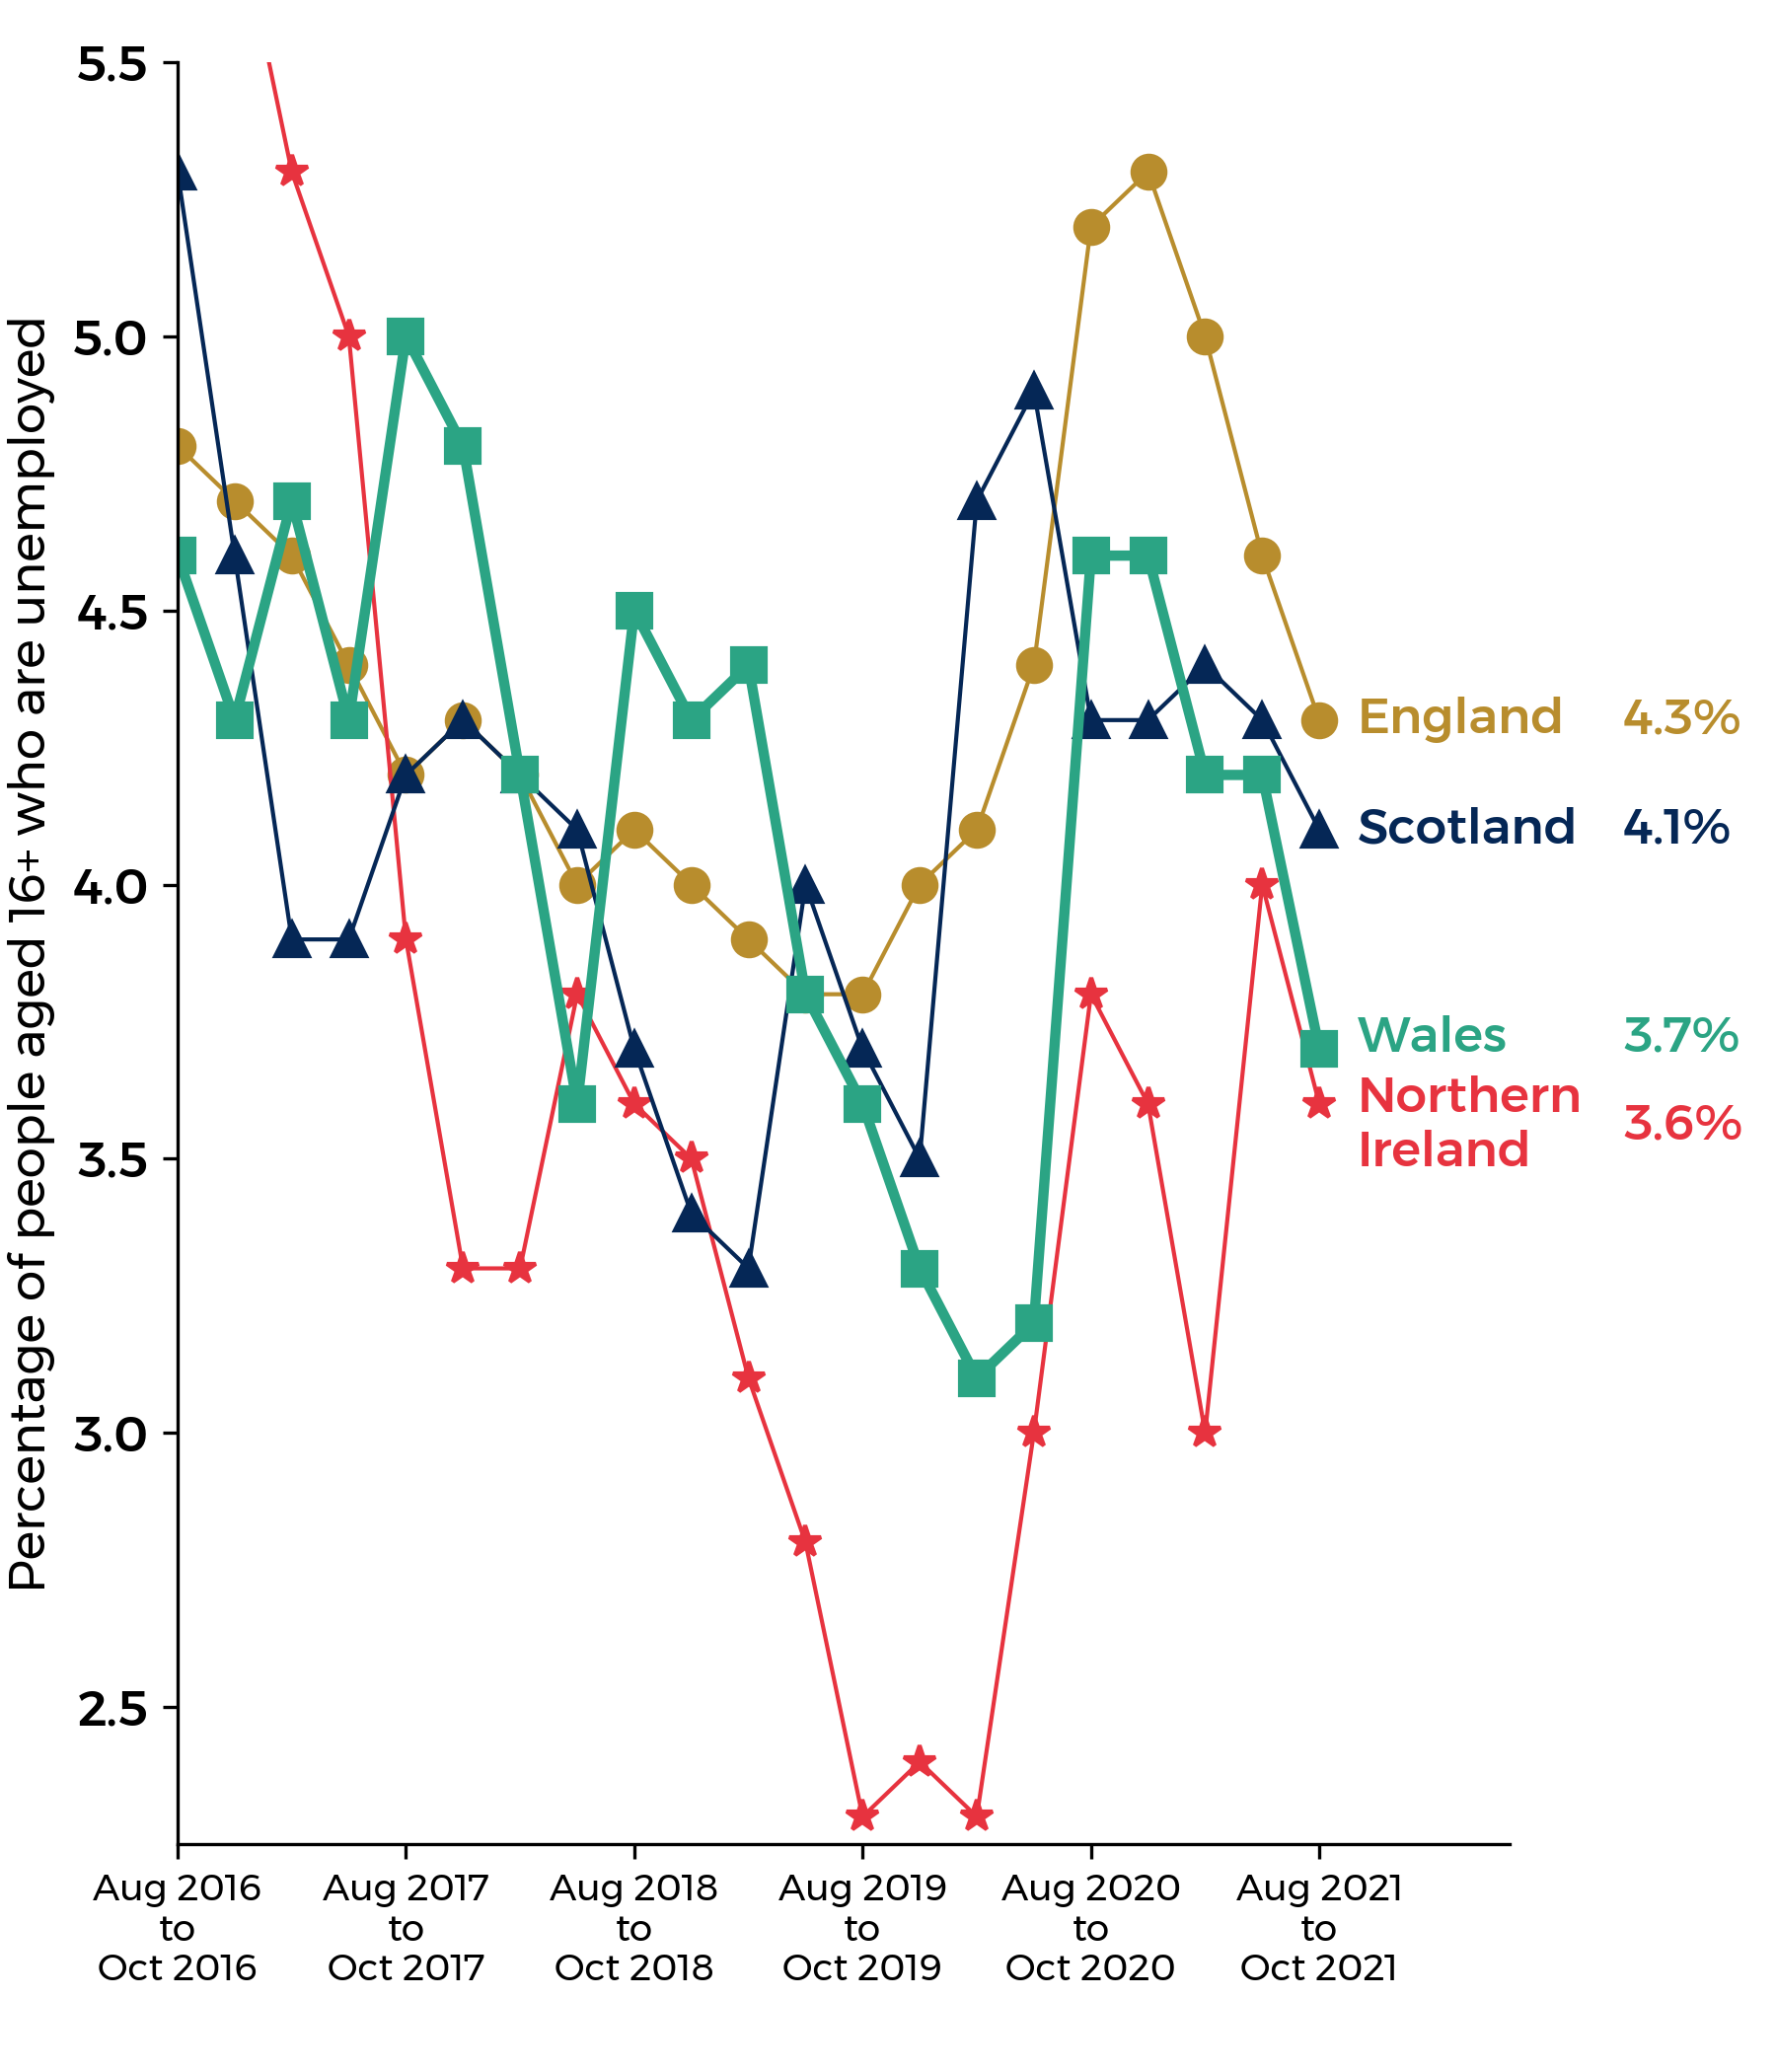
Source: ONS, Labour market in the regions of the UK: December 2021
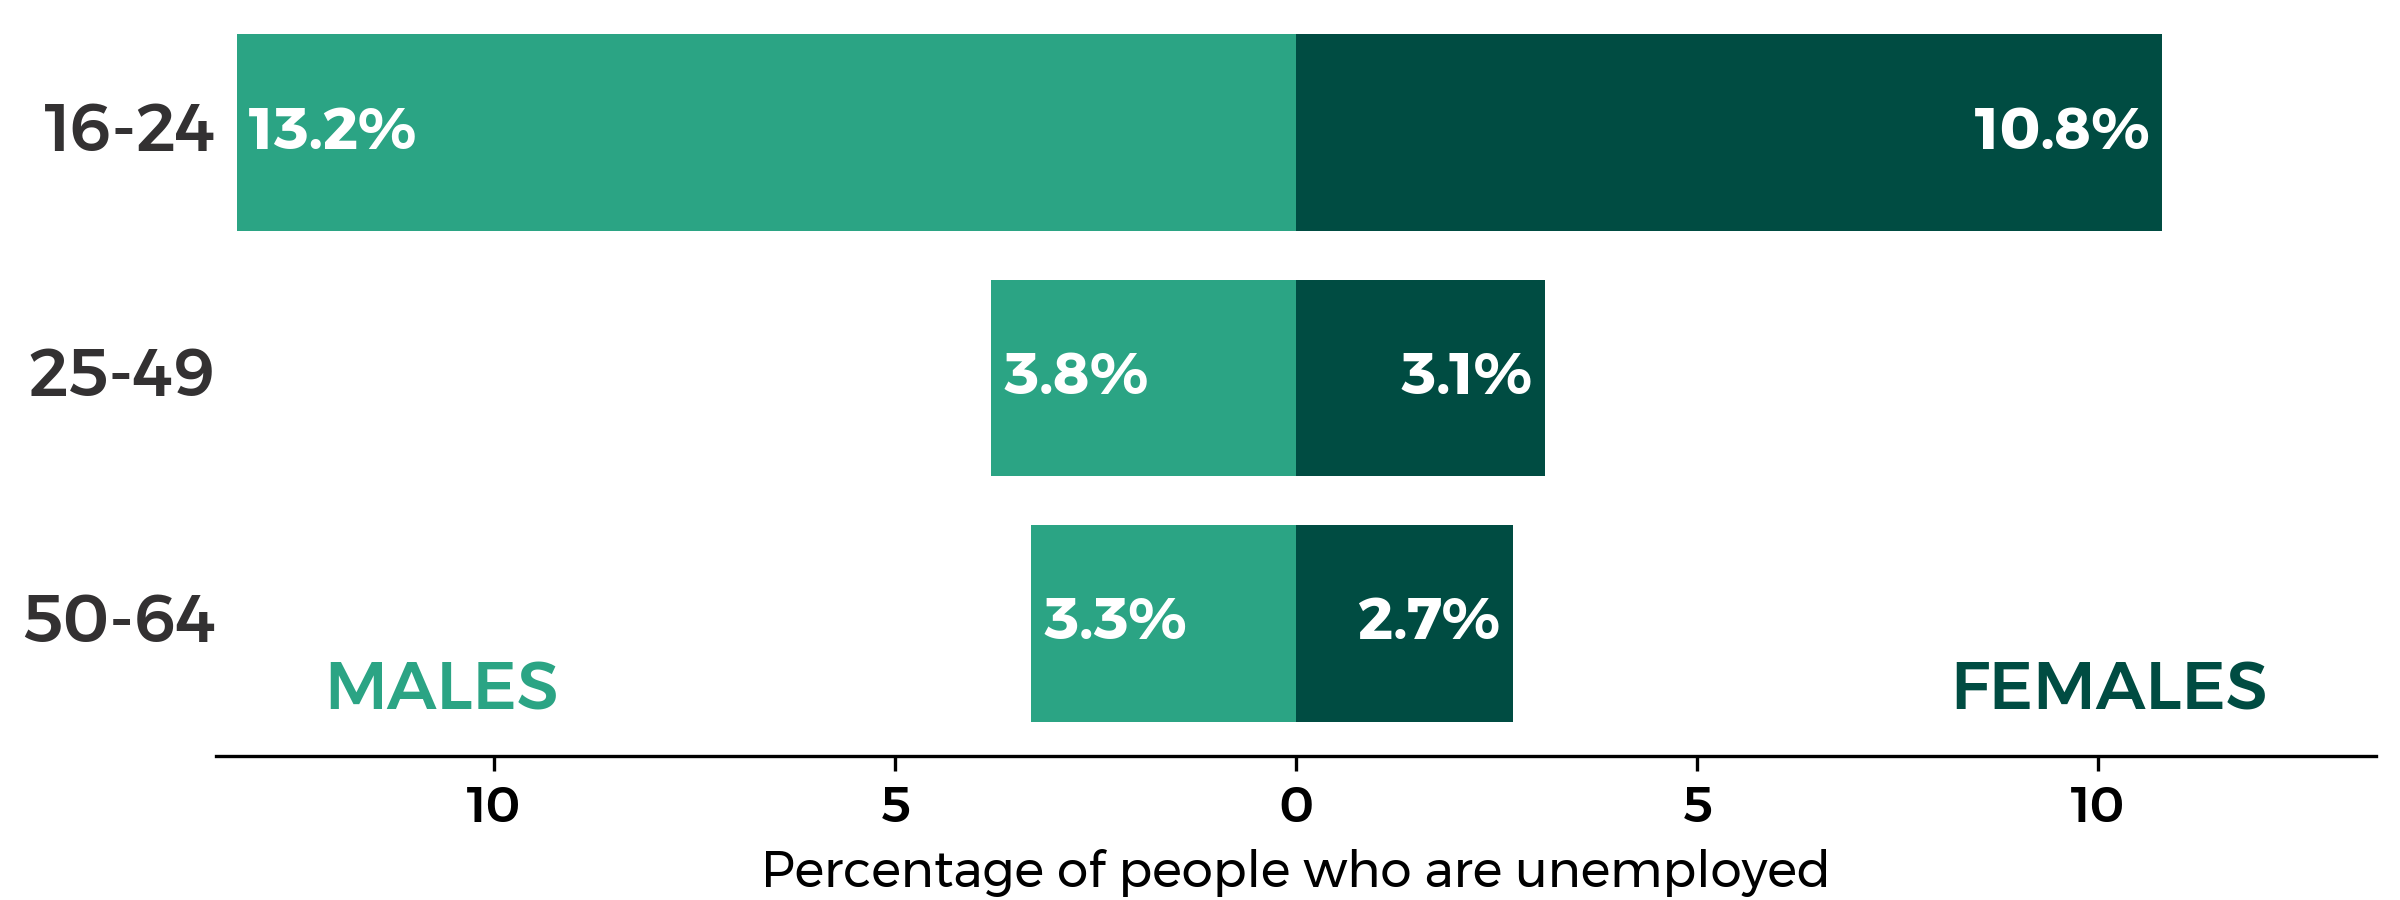
Data from the LFS is available showing the unemployment rate by sex and age for 12 months to June 2021. The latest data shows unemployment rates decrease with age for both males and females. In all the age groups males have higher unemployment rates than females.
Unemployment rate by age and sex in Wales; 12 months to June 2021
Unemployment data is also available by parliamentary constituency. The map below shows for the 12 months to June 2021. Swansea West had the highest rate (8.3%) and Aberconwy and Islwyn the lowest rates (1.8%).
Note: The sample sizes in Clwyd West and Cardiff Central are too small to provide estimates.
Are there other data we can use to see the impact of coronavirus on the labour market in Wales?
Claimant count figures are published monthly and are more timely. However, people in work can also be eligible for Universal Credit and included in the claimant count. ONS states;
As part of the response to the pandemic, the rules about who can claim Universal Credit have changed, meaning an increased proportion of those claiming may actually still be in some kind of work. Because of these reasons, the change in the claimant count almost certainly ends up overstating any underlying change in unemployment.
ONS has also been working with HMRC to produce estimates of employees being paid through the PAYE system. The PAYE seasonally adjusted data for November 2021 (1,283,285) shows the number of payrolled employees in Wales is above the number in February 2020. There was an increase of 7,310 payrolled employees between October and November 2021.
Claimant count - seasonally adjusted
ONS publishes an experimental series counting the number of people claiming Jobseeker's Allowance plus those who claim Universal Credit and are required to seek work and be available for work. This replaces the number of people claiming Jobseeker's Allowance as the headline indicator of the number of people claiming benefits principally for the reason of being unemployed. The latest data for November 2021 show that the Wales claimant count went up from 59,173 in March 2020 to 119,232 in August 2020, then decreasing to 82,131 in November 2021.
Claimant count for Wales; November 2019 to November 2021
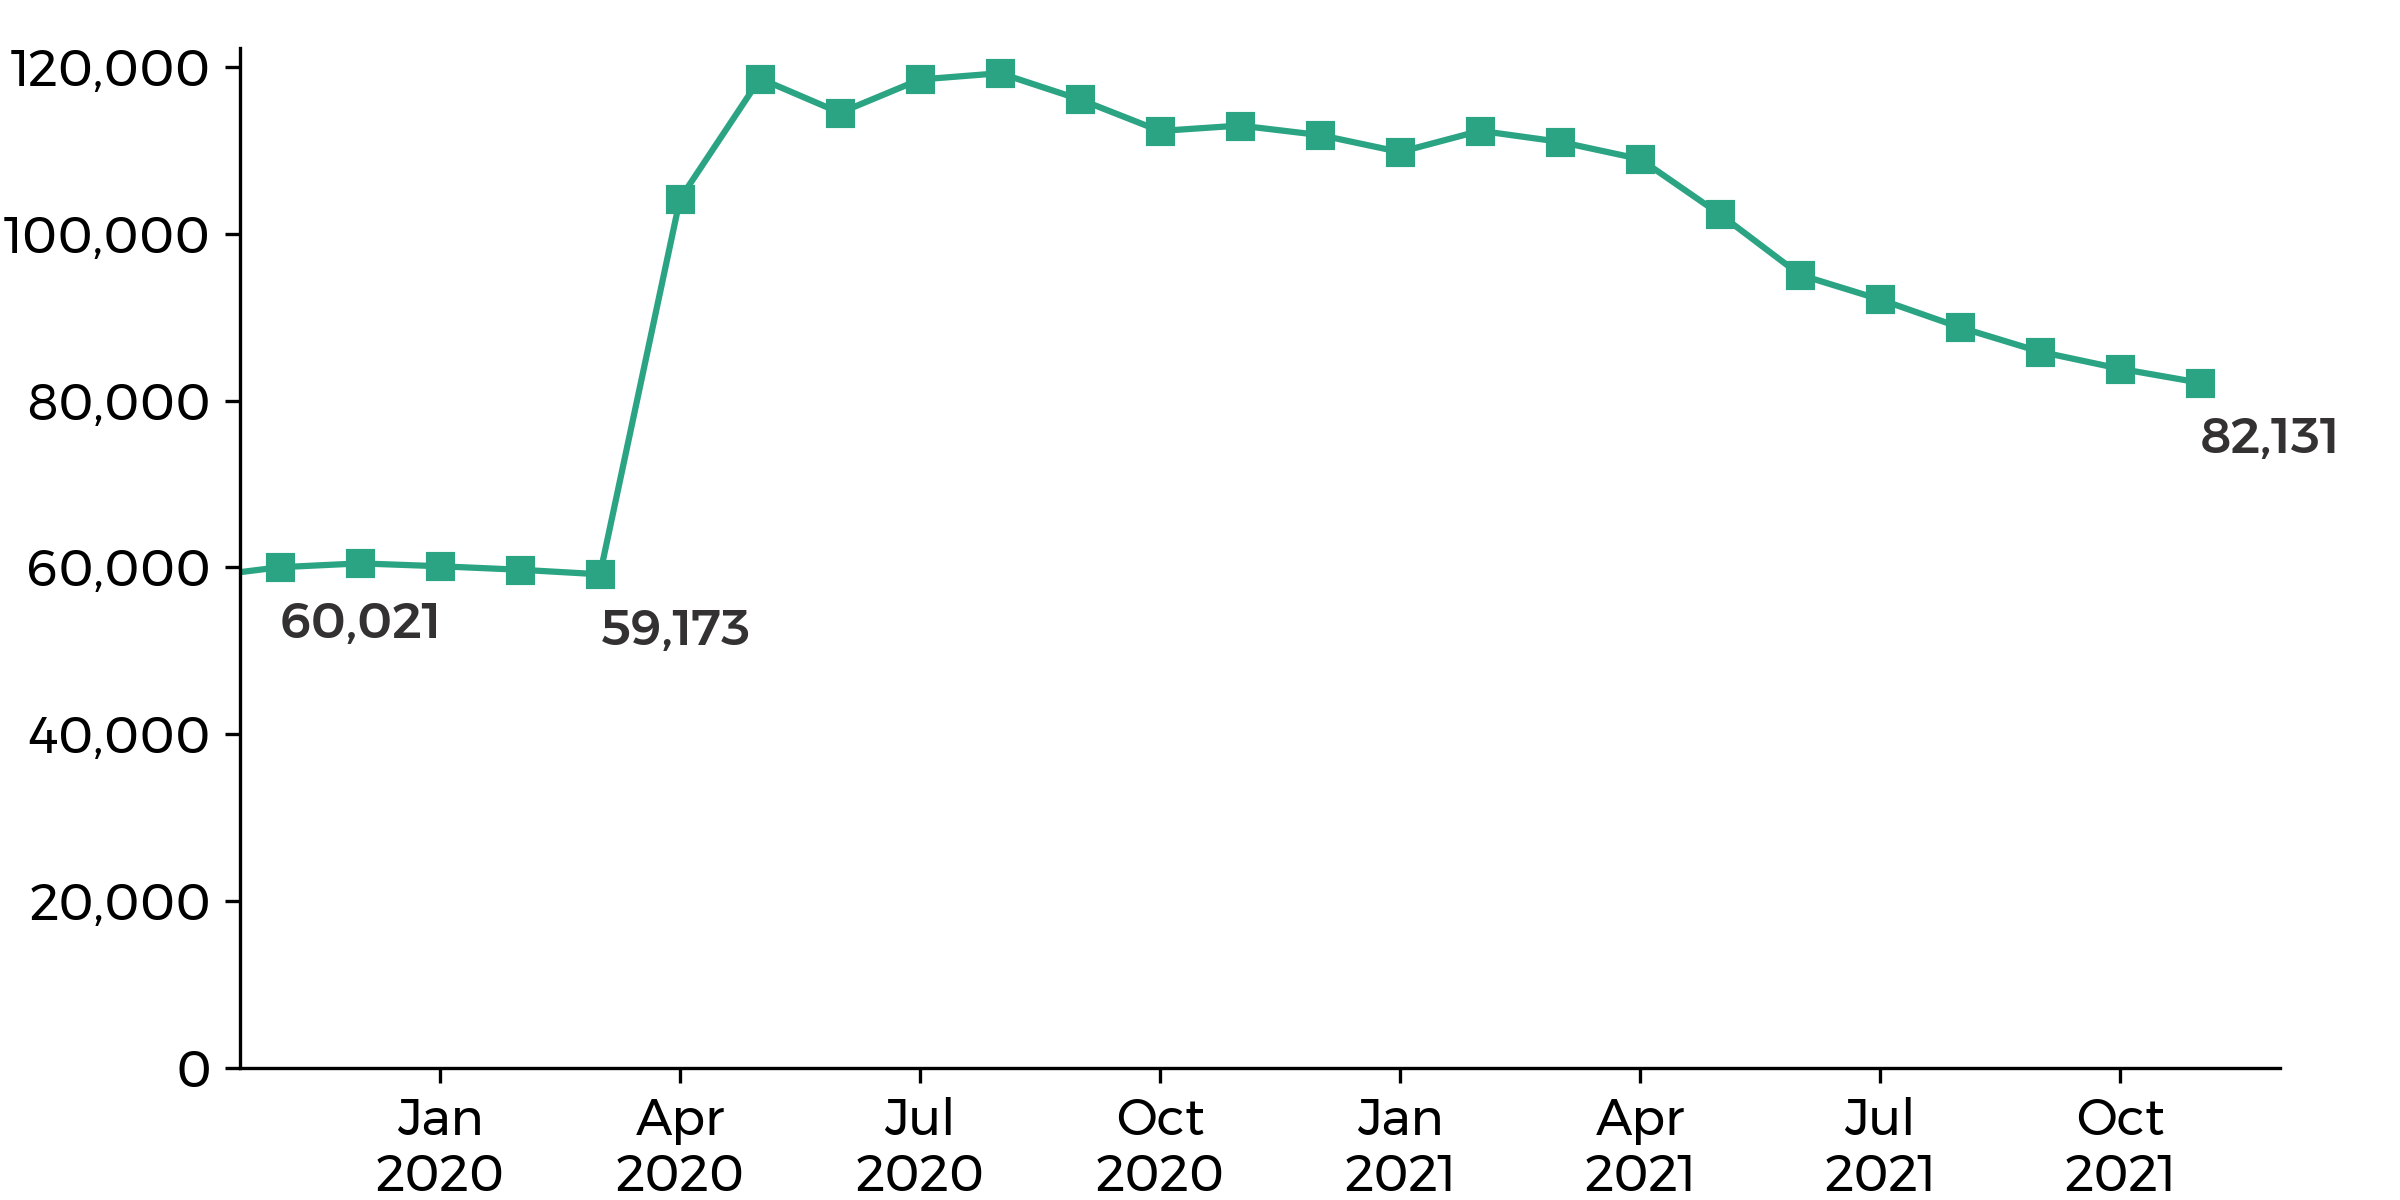
Source, NOMIS, ONS Claimant Count – seasonally adjusted
Notes: From May 2013 onwards these figures are considered Experimental Statistics. Under Universal Credit a broader span of claimants are required to look for work than under Jobseeker's Allowance. As Universal Credit Full Service is rolled out in particular areas, the number of people recorded as being on the Claimant Count is likely to rise. Rates for regions and countries from 2018 onwards are calculated using the mid-2018 resident population aged 16-64.
Definitions
The number of unemployed people in the UK includes people who meet the definition of unemployment specified by the International Labour Organisation (ILO). The ILO defines unemployed people as being:
- without a job, have been actively seeking work in the past four weeks and are available to start work in the next two weeks
- out of work, have found a job and are waiting to start it in the next two weeks
Employment measures the number of people aged 16 years and over in paid work. The headline measure of employment for the UK is the employment rate for those aged from 16 to 64 years.
The headline measure of inactivity for the UK is the rate of those aged from 16 to 64 without a job who have not sought work in the last four weeks and/or are not available to start work in the next two weeks.
Article by Joe Wilkes and Helen Jones, Senedd Research, Welsh Parliament