


|
This is an update of our July 2025 article ‘Cars, cows, and coal: Welsh emissions from 1990 to 2023’ to include new data for 2024. |
Greenhouse gas (GHG) emissions are the primary cause of climate change. These gases are released from a variety of activities central to modern life – from driving petrol and diesel vehicles, to generating electricity, and farming.
This article uses the latest Welsh GHG emissions statistics to explore major sources and trends in emissions between 1990 and 2024.
|
Highlights:
|
Background
Wales legally committed to net zero GHG emissions by 2050 through a 2021 amendment to the Environment (Wales) Act 2016. The Act also requires the Welsh Government to gradually reduce emissions in two ways: interim emissions reduction targets for 2020, 2030, and 2040; and cumulative five-year carbon budgets.
Annual territorial emissions data for UK nations are published by the UK National Atmospheric Emissions Inventory (NAEI). Collating and verifying the data takes time, so the June 2026 data release relates to territorial emissions up to 2024. Territorial emissions include all emissions within Wales, but exclude emissions embedded into products and services imported into the country from the rest of the UK and overseas. An alternative emissions metric using estimated ‘consumption’ is explored at the end of this article.
Emissions reductions are measured relative to a ‘baseline’ year – which is 1990 for the most common greenhouse gases, such as carbon dioxide, and 1995 for some uncommon but more powerful greenhouse gases. Throughout this article, ‘1990’ is used to mean the baseline. Emissions are measured in kilotonnes carbon dioxide equivalent (kTCO2e), allowing gases with different warming potentials to be directly compared.
Total emissions in 2024
Wales’ absolute emissions are small in the global context. Its 30,130 ktCO2e in 2024 makes up less than 0.1% of the worldwide total. However, adjusting for its population, Welsh emissions are 9.5 TCO2e per-person, which is 65% higher than the global average, and the second-highest among UK nations (after Northern Ireland).
National and international per-person GHG emissions
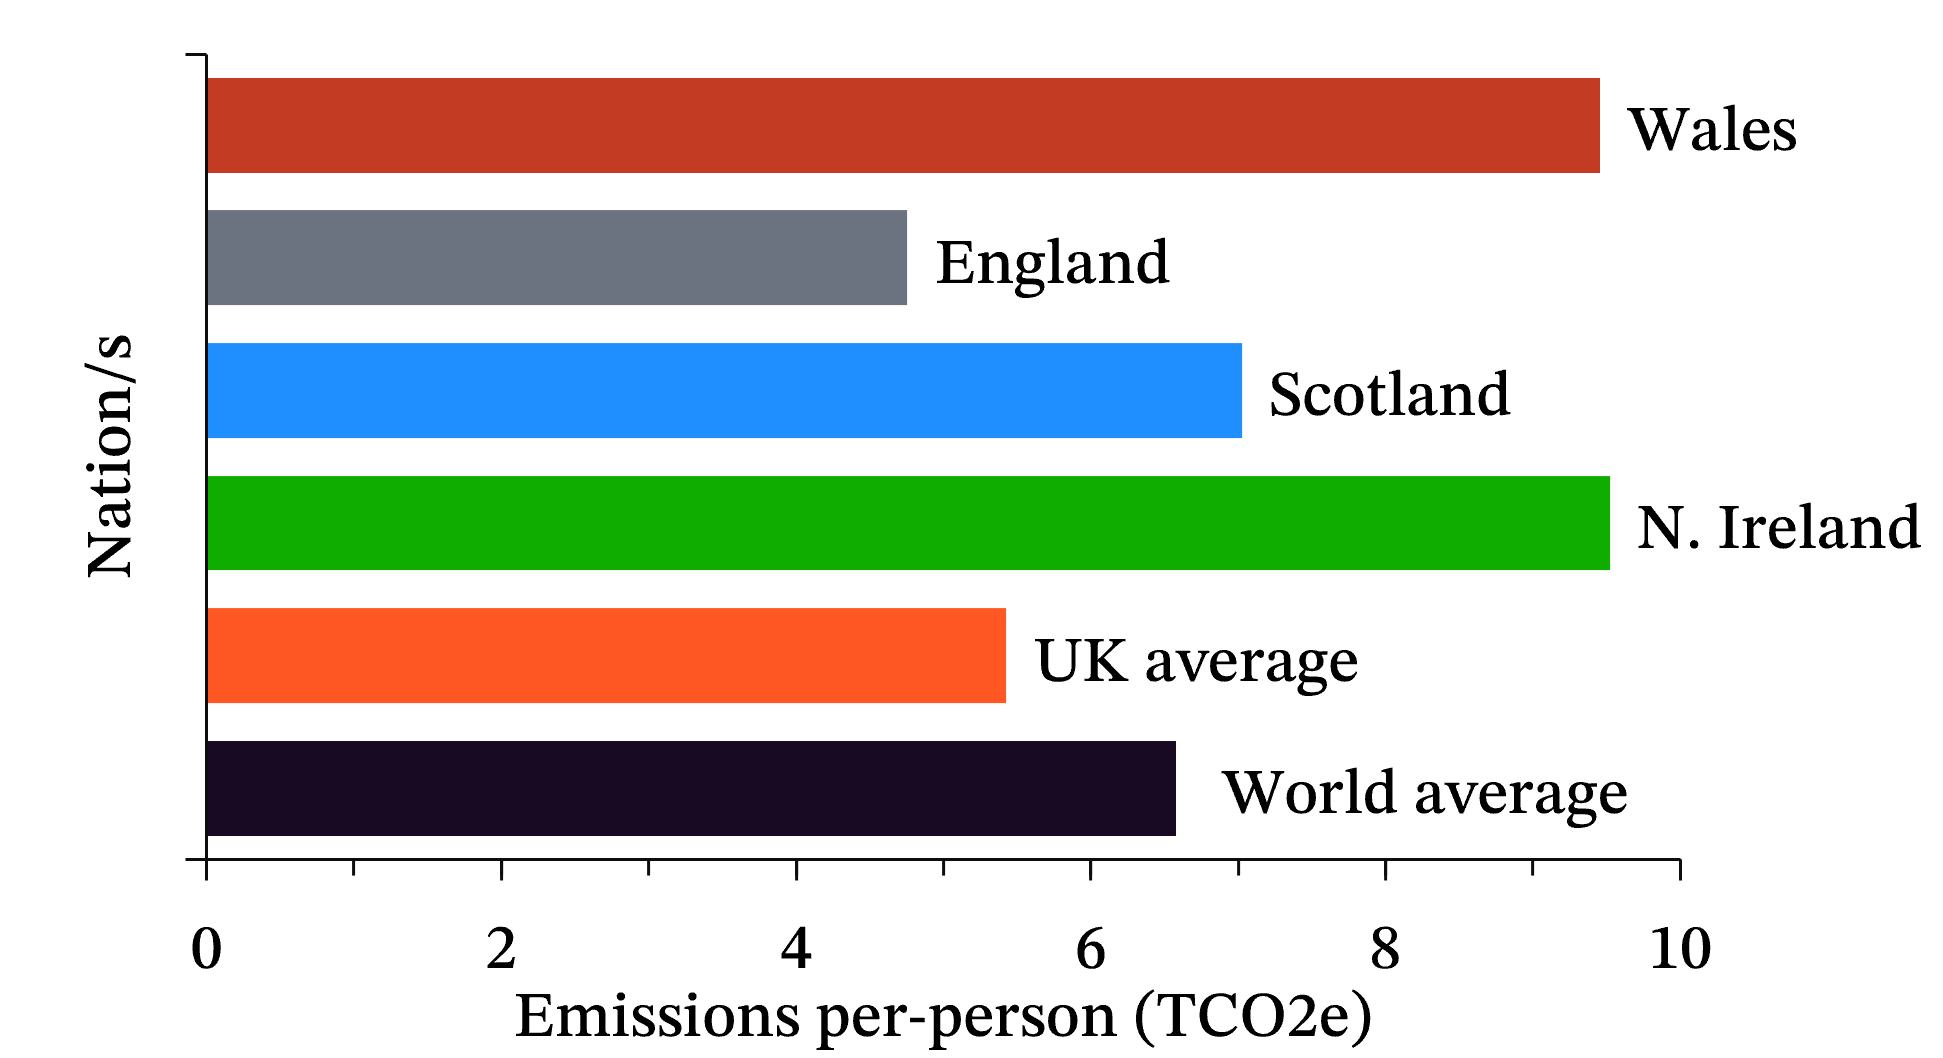
Source: Senedd Research analysis of data from NAEI, Office for National Statistics, United Nations, European Commission.
Within the UK, Wales has a disproportionate number of highly-emitting point sources, including gas power stations at Pembroke and Connah’s Quay, Pembroke oil refinery, and cement plants at Padeswood and Aberthaw.
As one of the first countries in the world to industrialise, Wales’ historic contribution to climate change is also higher than most similarly-sized nations.
Emissions are falling over time
Up to 2024, total Welsh emissions have fallen by 44.2% compared to 1990. The Welsh Government achieved its first carbon budget (2016-2020) and 2020 interim target.
Total emissions in 2024 were the lowest on record, falling by 8.6% compared to 2023.
Welsh territorial emissions, targets, and carbon budgets, 1990 to 2050
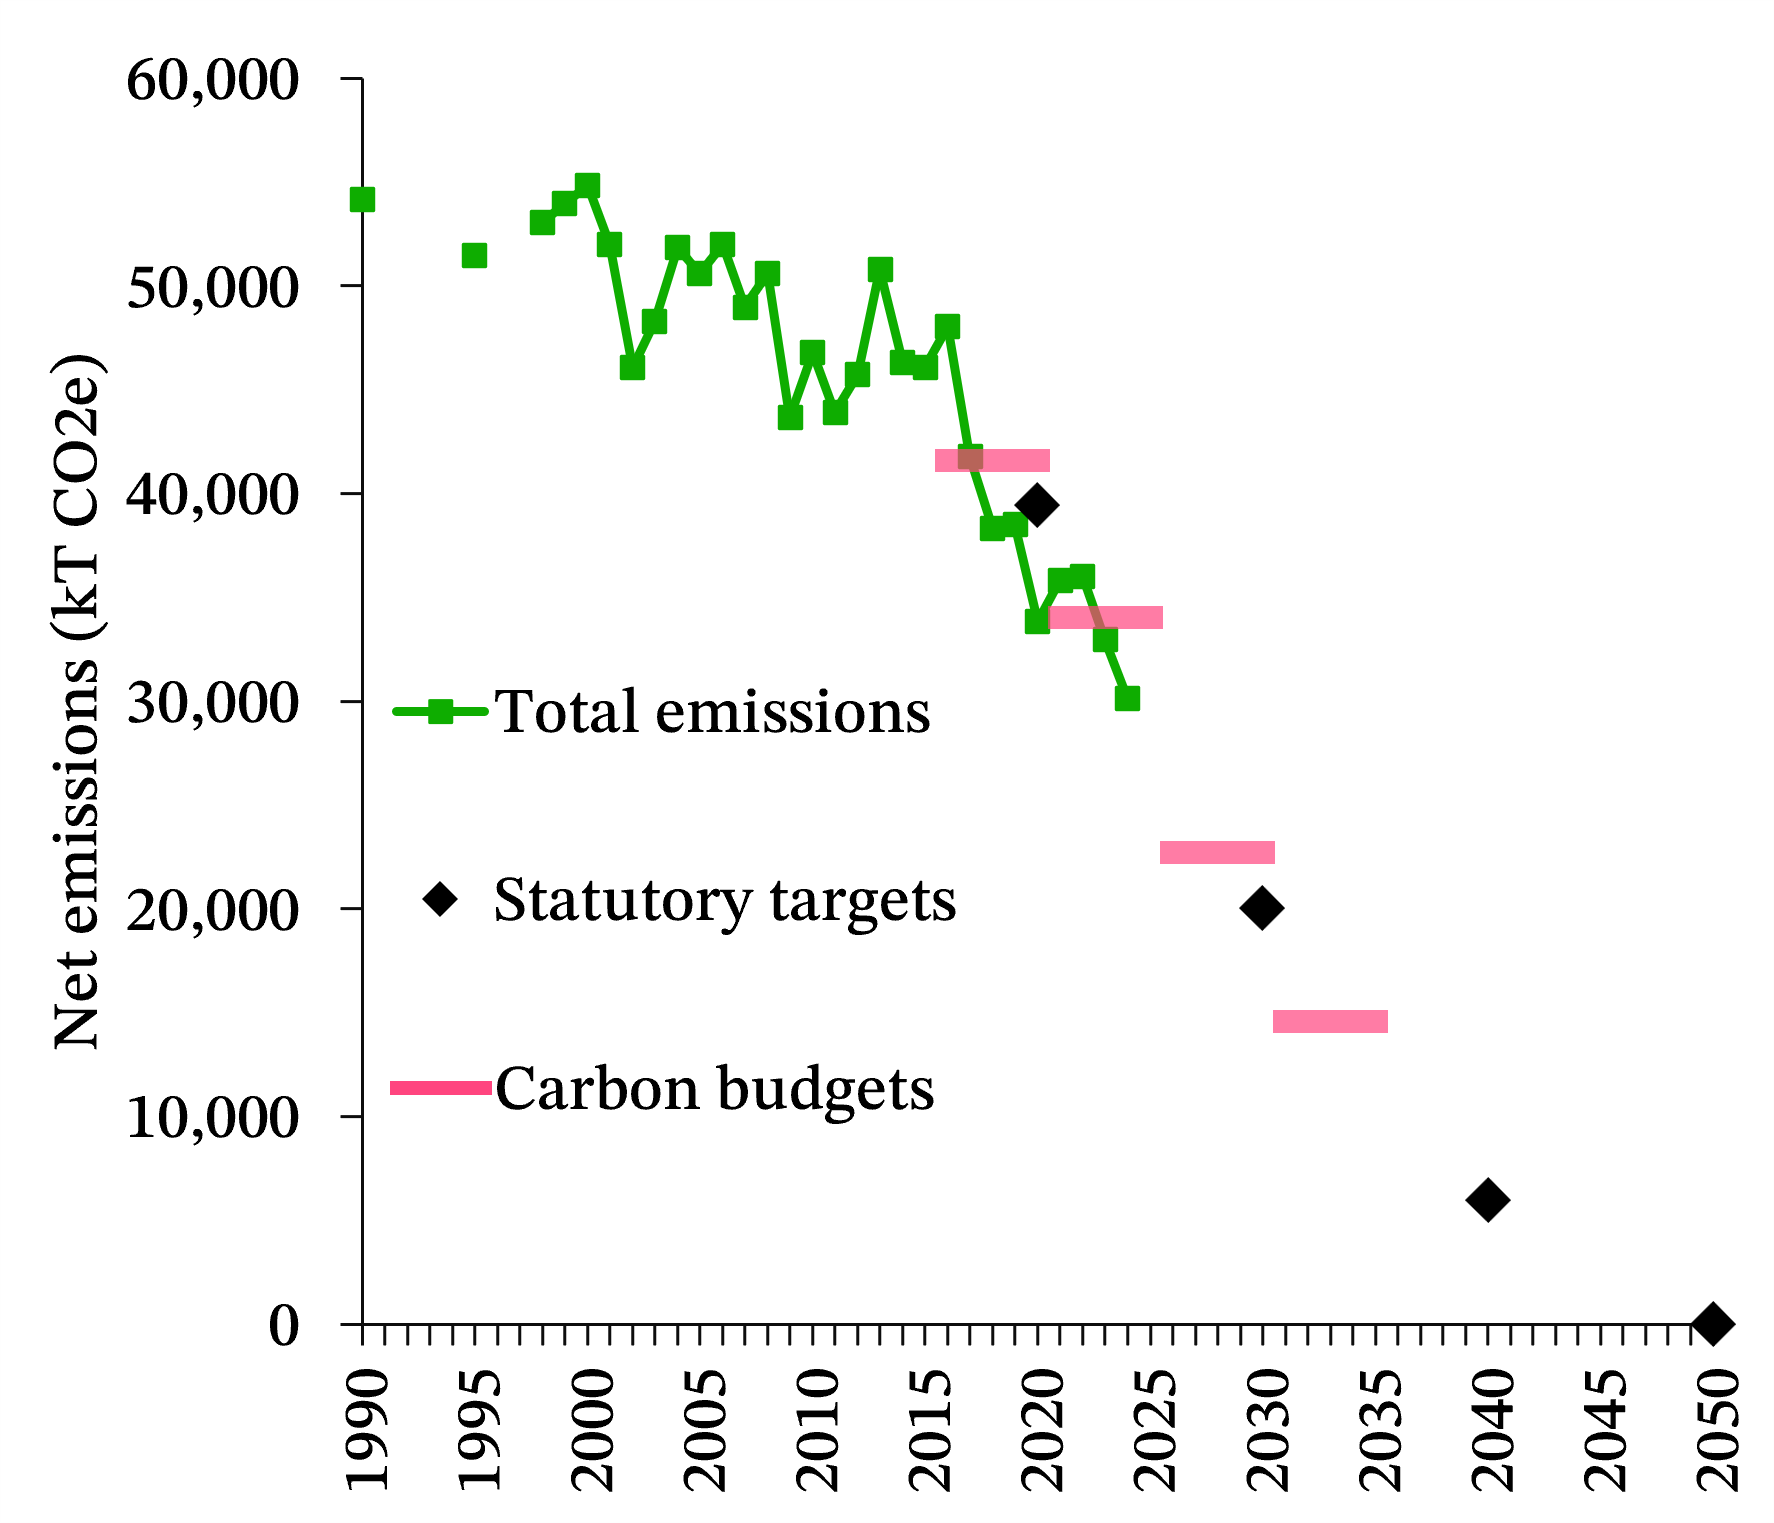
Source: Senedd Research analysis of data from NAEI and Welsh Government
The Welsh Government will achieve the second carbon budget (2021-25), unless emissions rose dramatically in 2025. Emissions will need to fall by 34% between 2024 and the end of the decade for Wales to meet the 2030 interim target
In December 2025, the Senedd agreed to set the level of carbon budget 4 (2031-2035) at 73% lower than 1990, in line with the recommendation of the independent Climate Change Committee (CCC).
Where do Wales’ emissions come from?
Sources of greenhouse gases are diverse. Looking sector-by-sector, industry was the largest source of emissions in 2024, followed by domestic transport, agriculture, and electricity supply.
2024 emissions by sector
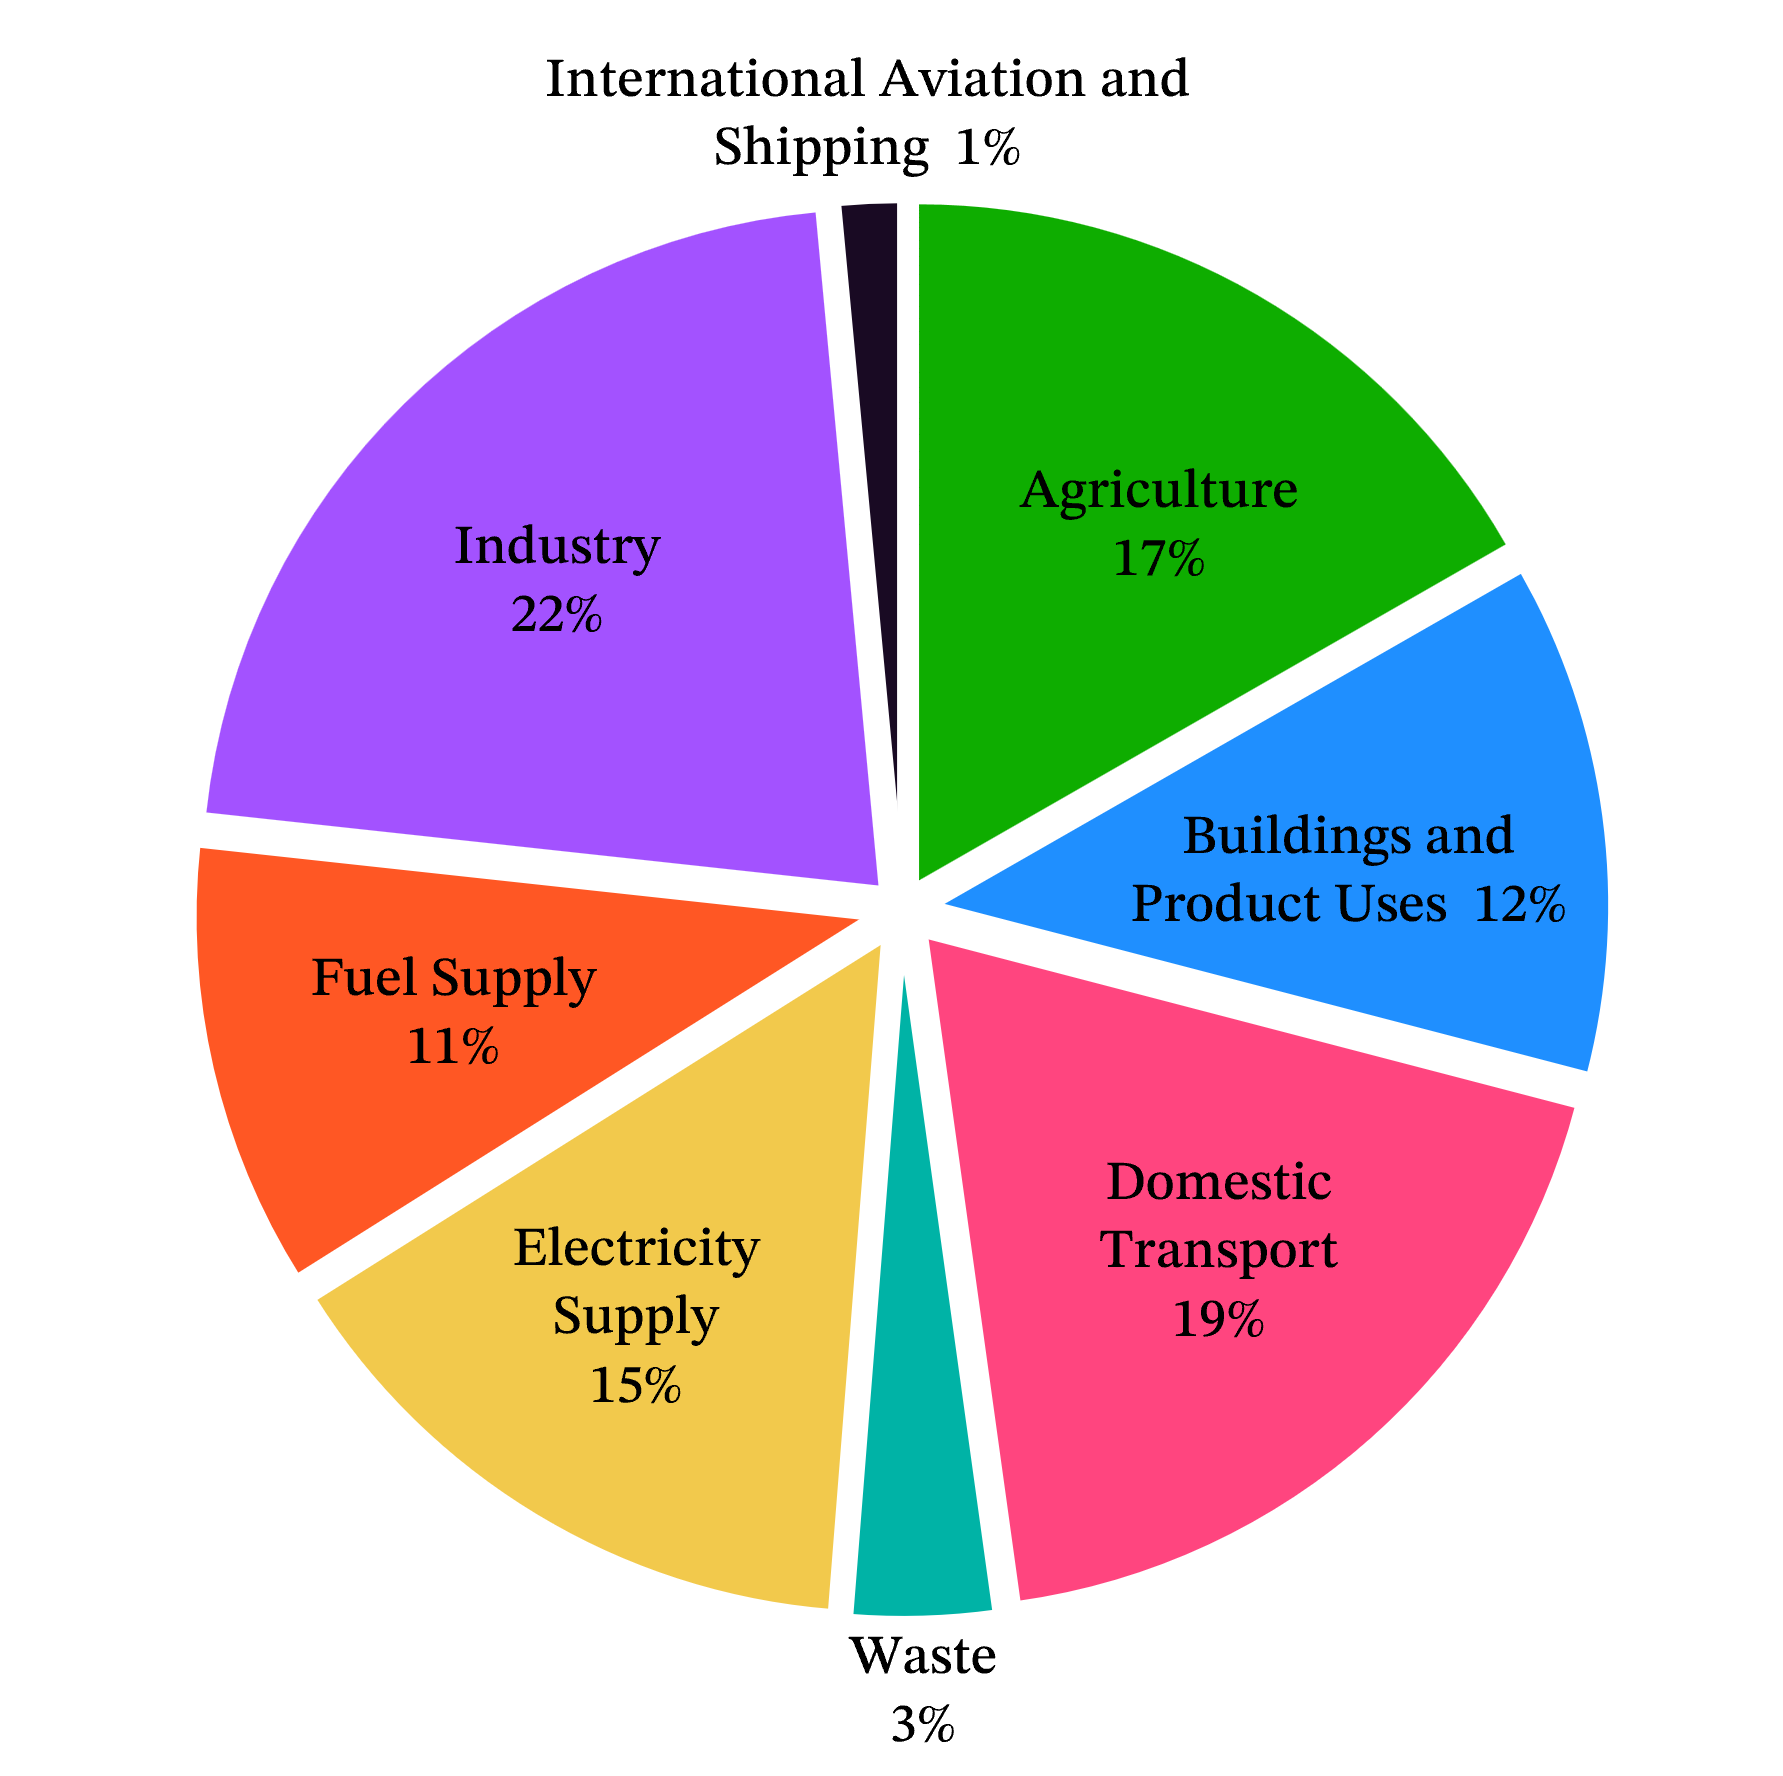
Source: Senedd Research analysis of NAEI data
The Welsh Government only has partial responsibility for reducing emissions. Some sectors are partially or fully reserved to the UK Government. This analysis divides sectors into ‘mostly reserved’ or ‘mostly devolved’ based on where policy powers lie, in line with CCC definitions.
2024 total emissions in reserved and devolved sectors
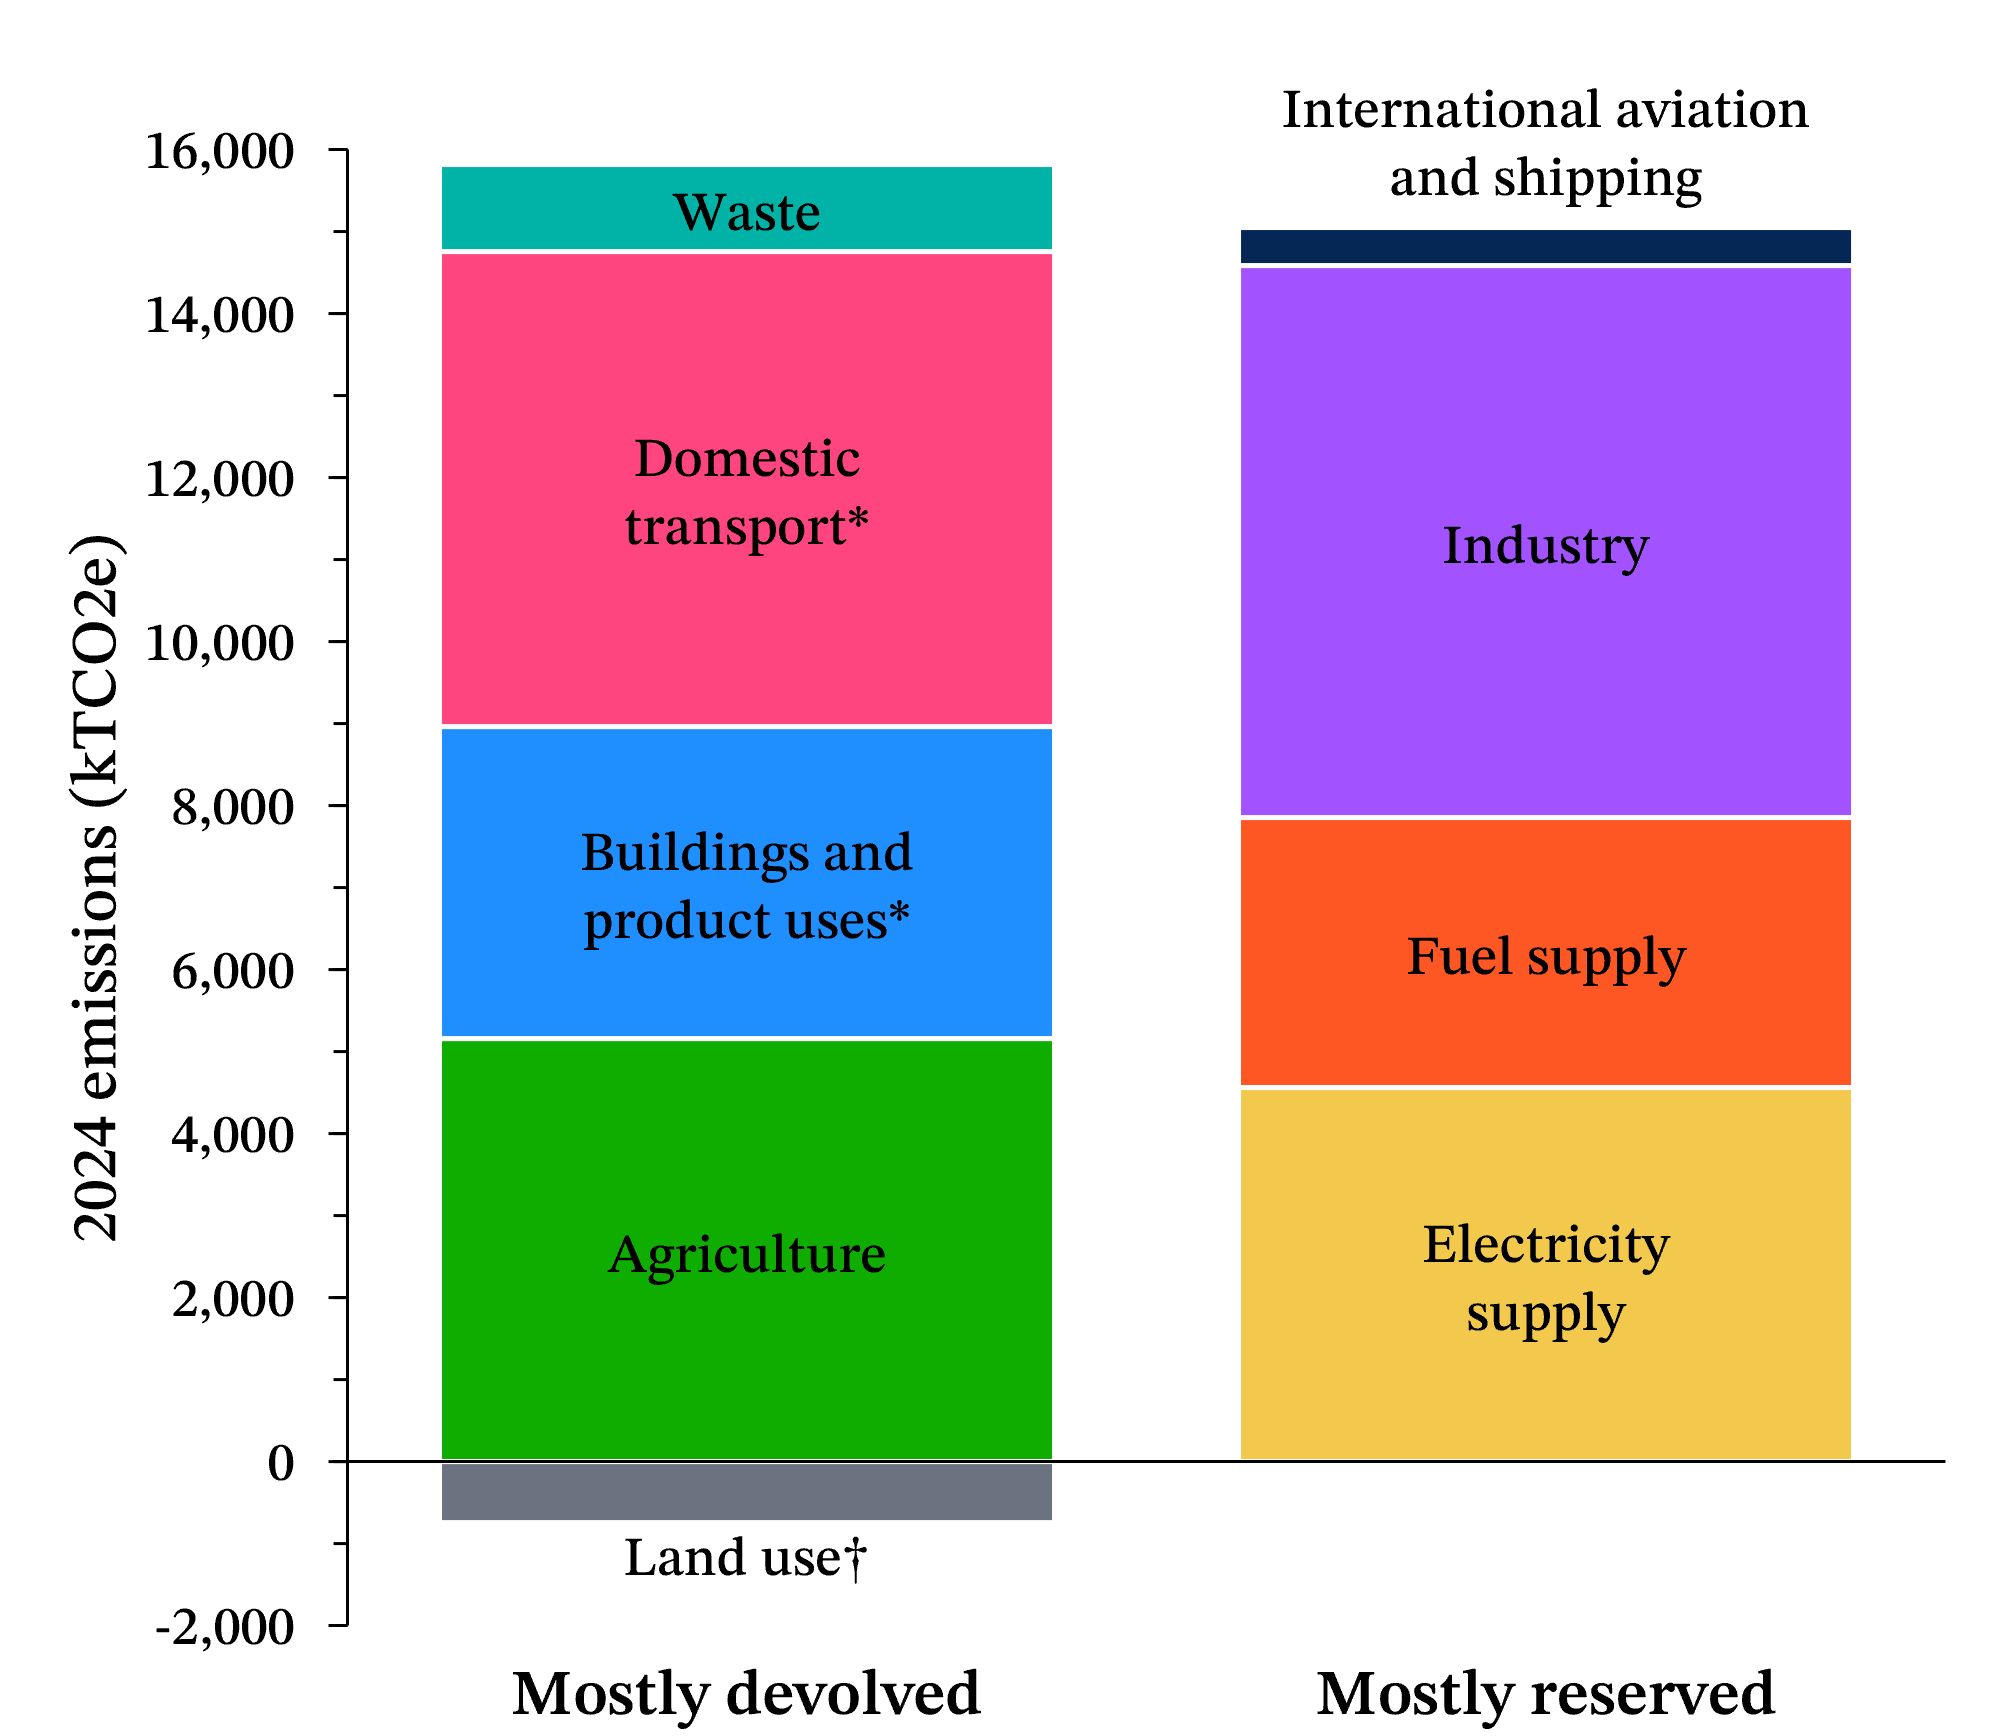
Source: Senedd Research analysis of NAEI data
*The CCC classifies ‘surface transport’ and ‘buildings’ as ‘partially devolved’.
†Land use change, including forestry and peatland, is a net sink of greenhouse gases. Therefore this sector’s ‘emissions’ are negative.
2024 was the first year that the majority (50.1%) of net Welsh emissions came from devolved sectors.
Devolved sectors have been slower to decarbonise
Emissions in every sector have fallen since 1990, but the size of this fall varies a lot. Reserved emissions have decreased by 55%, whilst devolved emissions have only declined by 28%.
Change in reserved and devolved emissions, 1999 to 2024
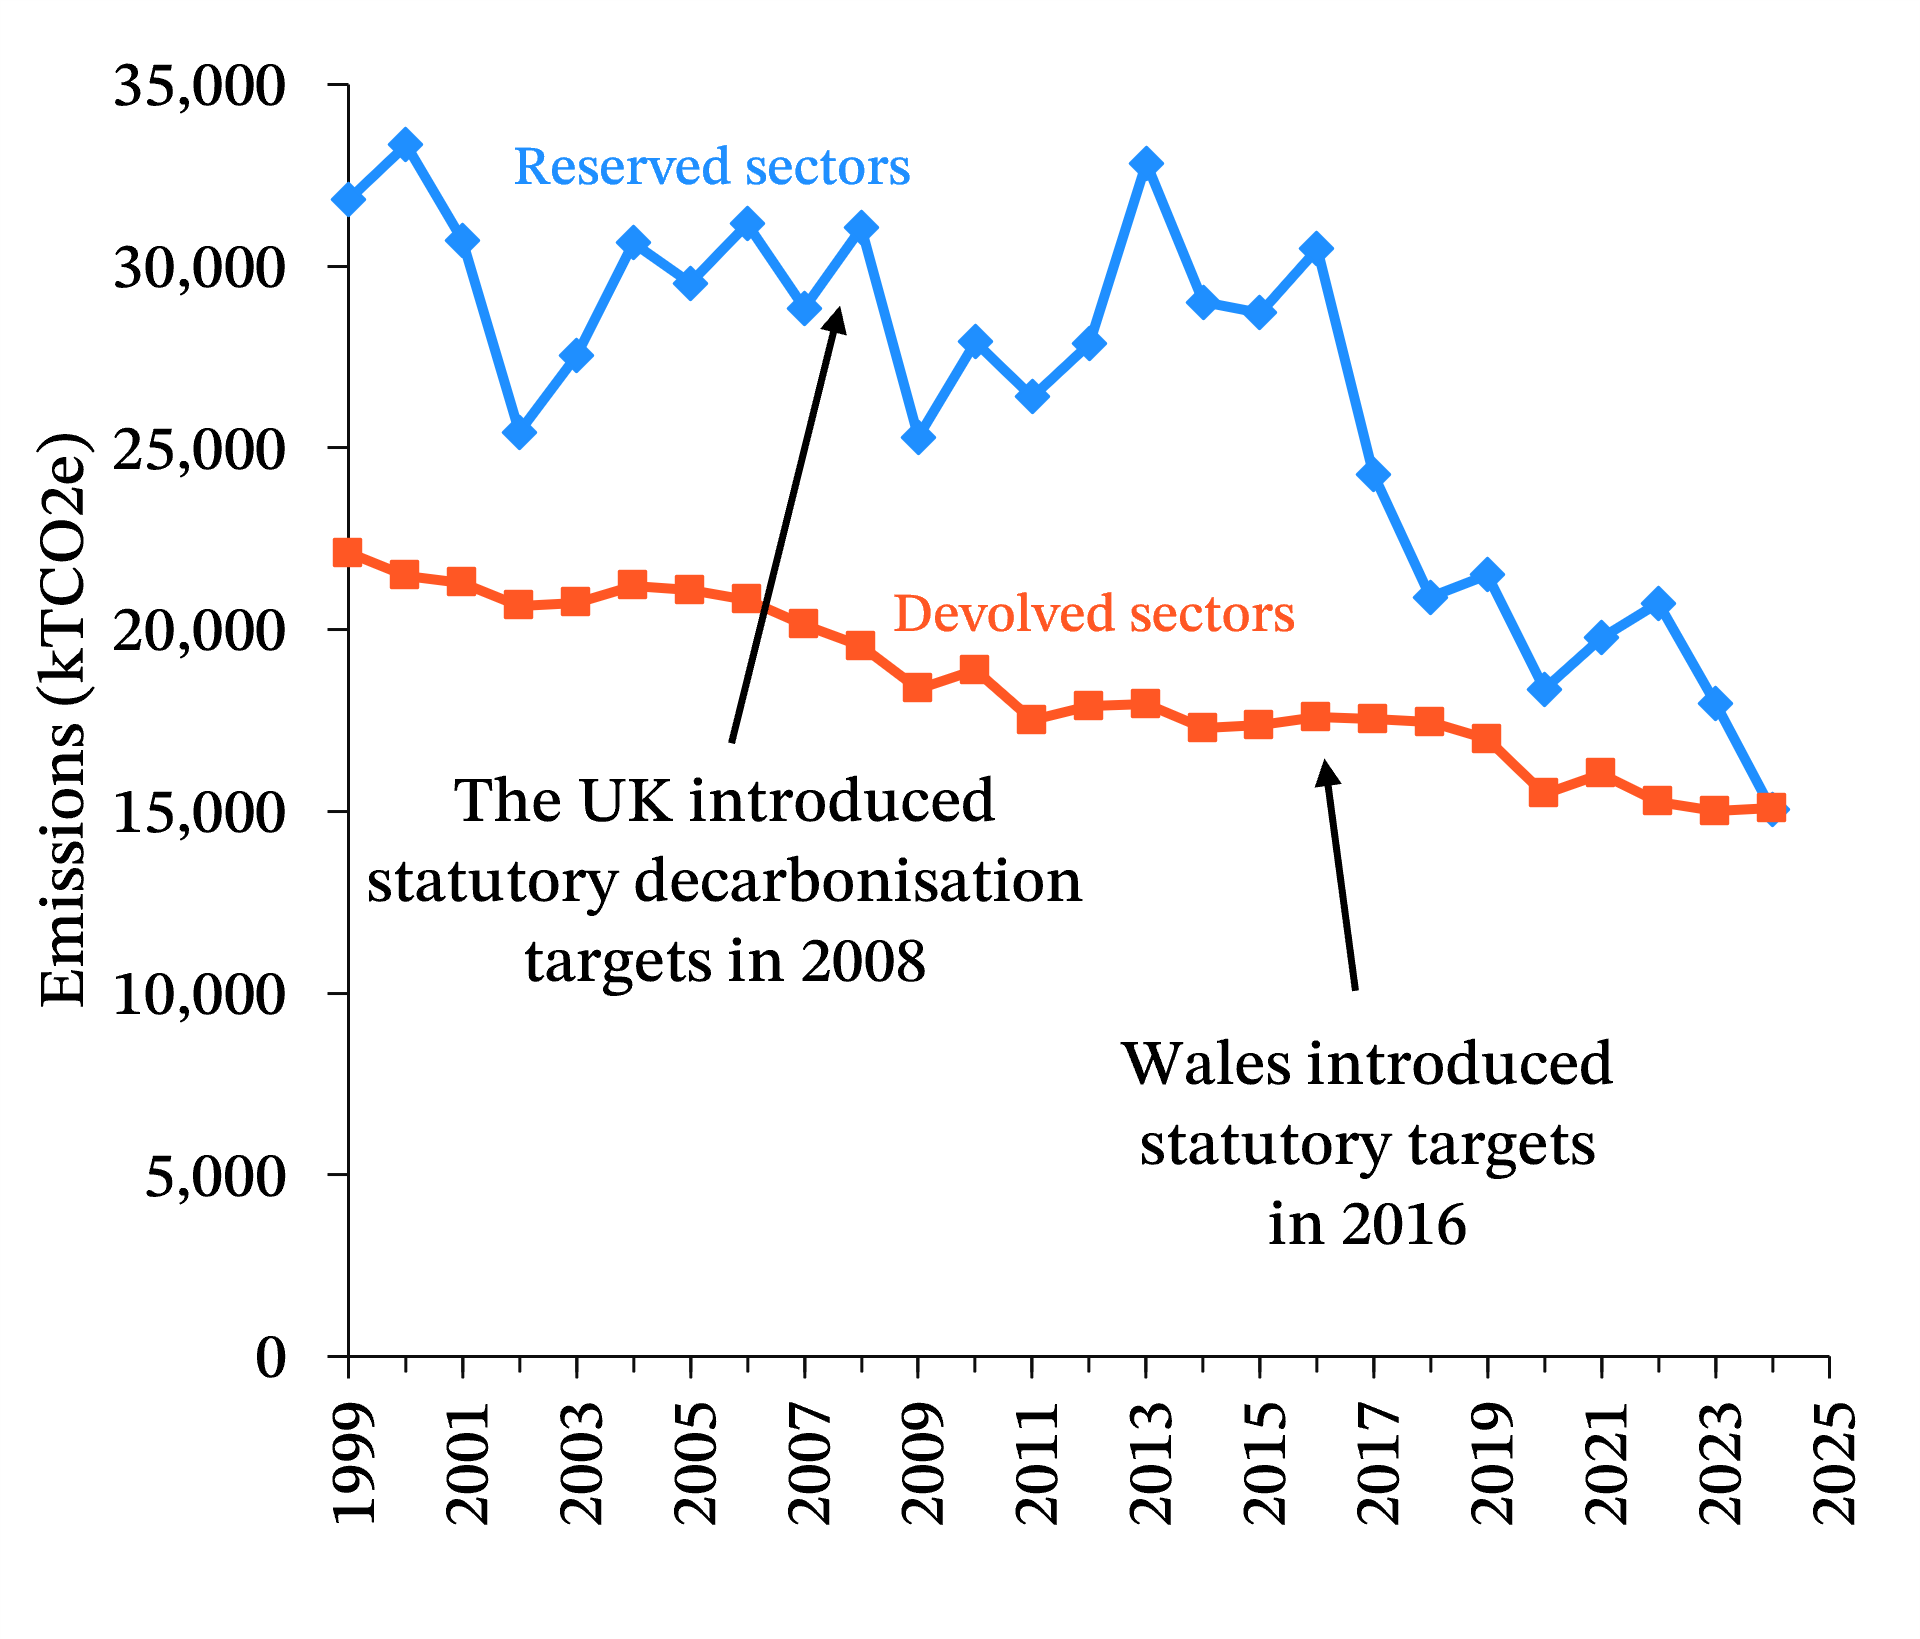
Source: Senedd Research analysis of NAEI data, Climate Change Act 2008, Environment (Wales) Act 2016.
The large fall in reserved emissions has been dominated by industry and electricity supply, which together account for more than 60% of Welsh decarbonisation since 1990. The closure of Wales’ last coal power station, and major growth in renewables such as wind and solar, accounts for a 72% decline in electricity supply emissions since 2016.
Annual Welsh emissions in reserved sectors, 1998 to 2024.
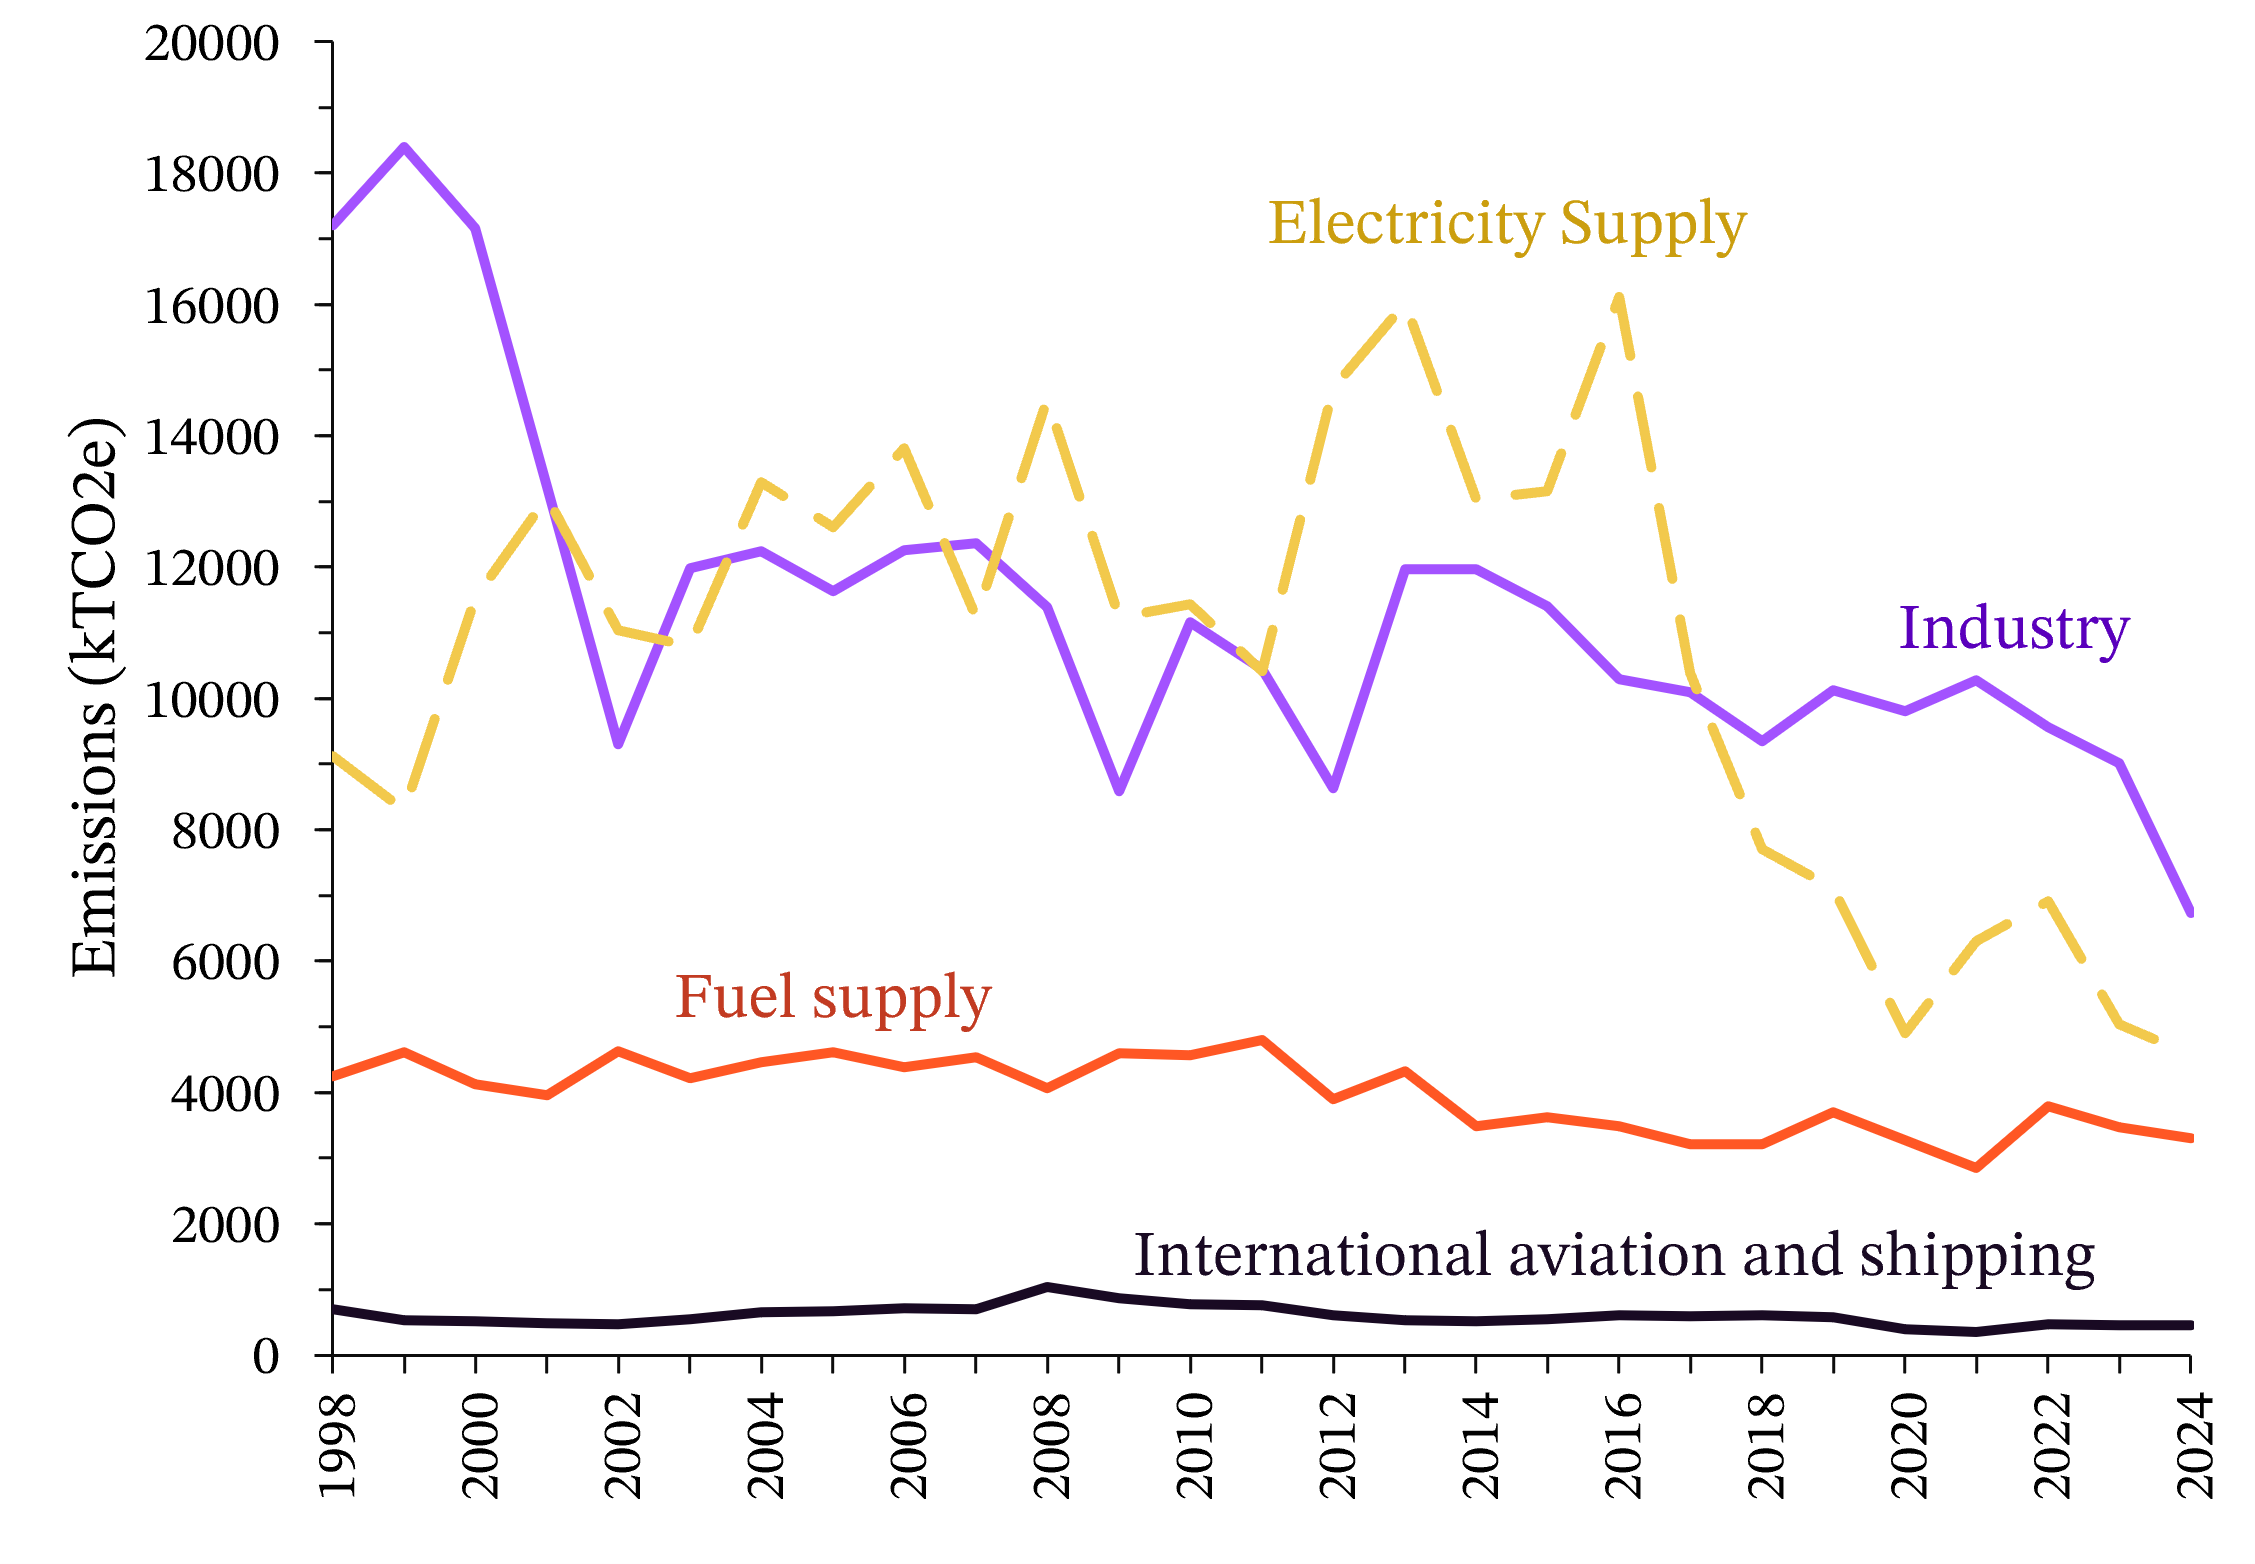
Source: Senedd Research analysis of NAEI data
Since 1990, emissions have more than halved in the waste, electricity supply, industry, and fuel supply sectors. There have been comparably modest declines in domestic transport (7%) and agriculture (14%).
Annual Welsh emissions in devolved sectors, 1998 to 2024
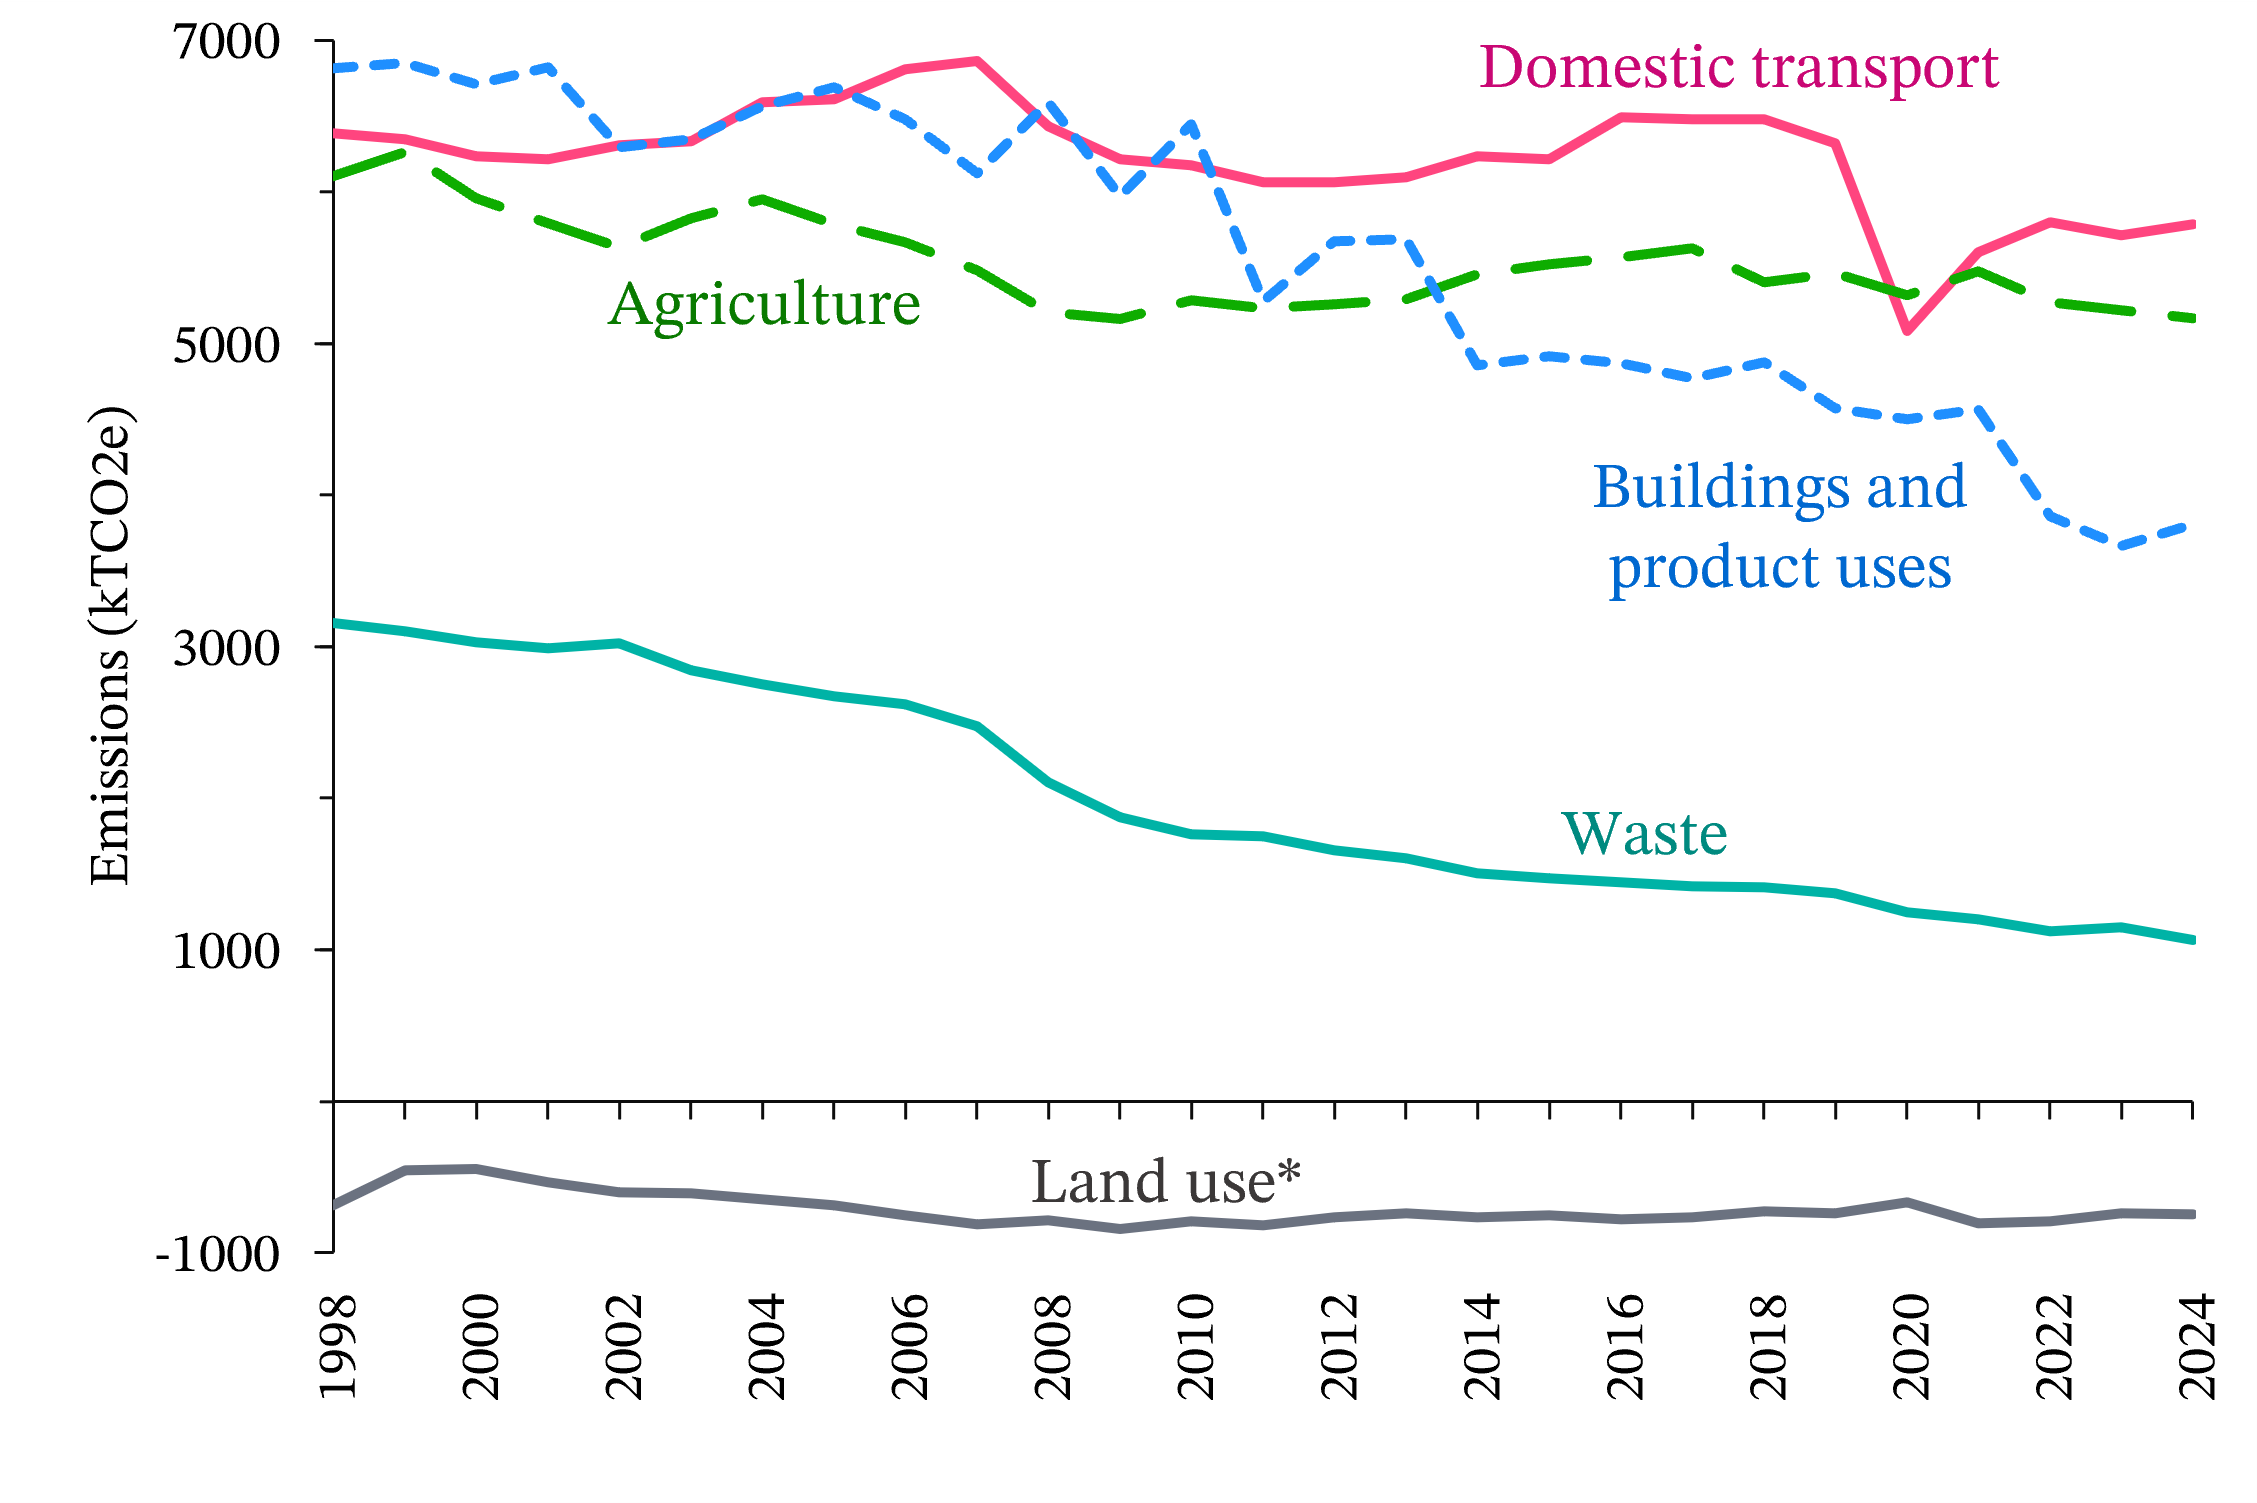
Source: Senedd Research analysis of NAEI data
*Land use change, including forestry and peatland, is a net sink of greenhouse gases. Therefore this sector’s ‘emissions’ are negative.
Steelworks closure lowers emissions in 2024
Total Welsh emissions fell by 8.6% in 2024, overwhelmingly driven by the closure of Port Talbot’s coal-fired blast furnaces. The closure lead to a 25% drop in industrial emissions. Electricity and fuel supply emissions also experienced large falls, resulting in an overall 16% fall in reserved emissions.
In contrast, devolved sector emissions rose by 0.5%, with almost no change in the agriculture or transport sectors, and a slight rise in building emissions.
Annual emissions change by sector, 2023-24
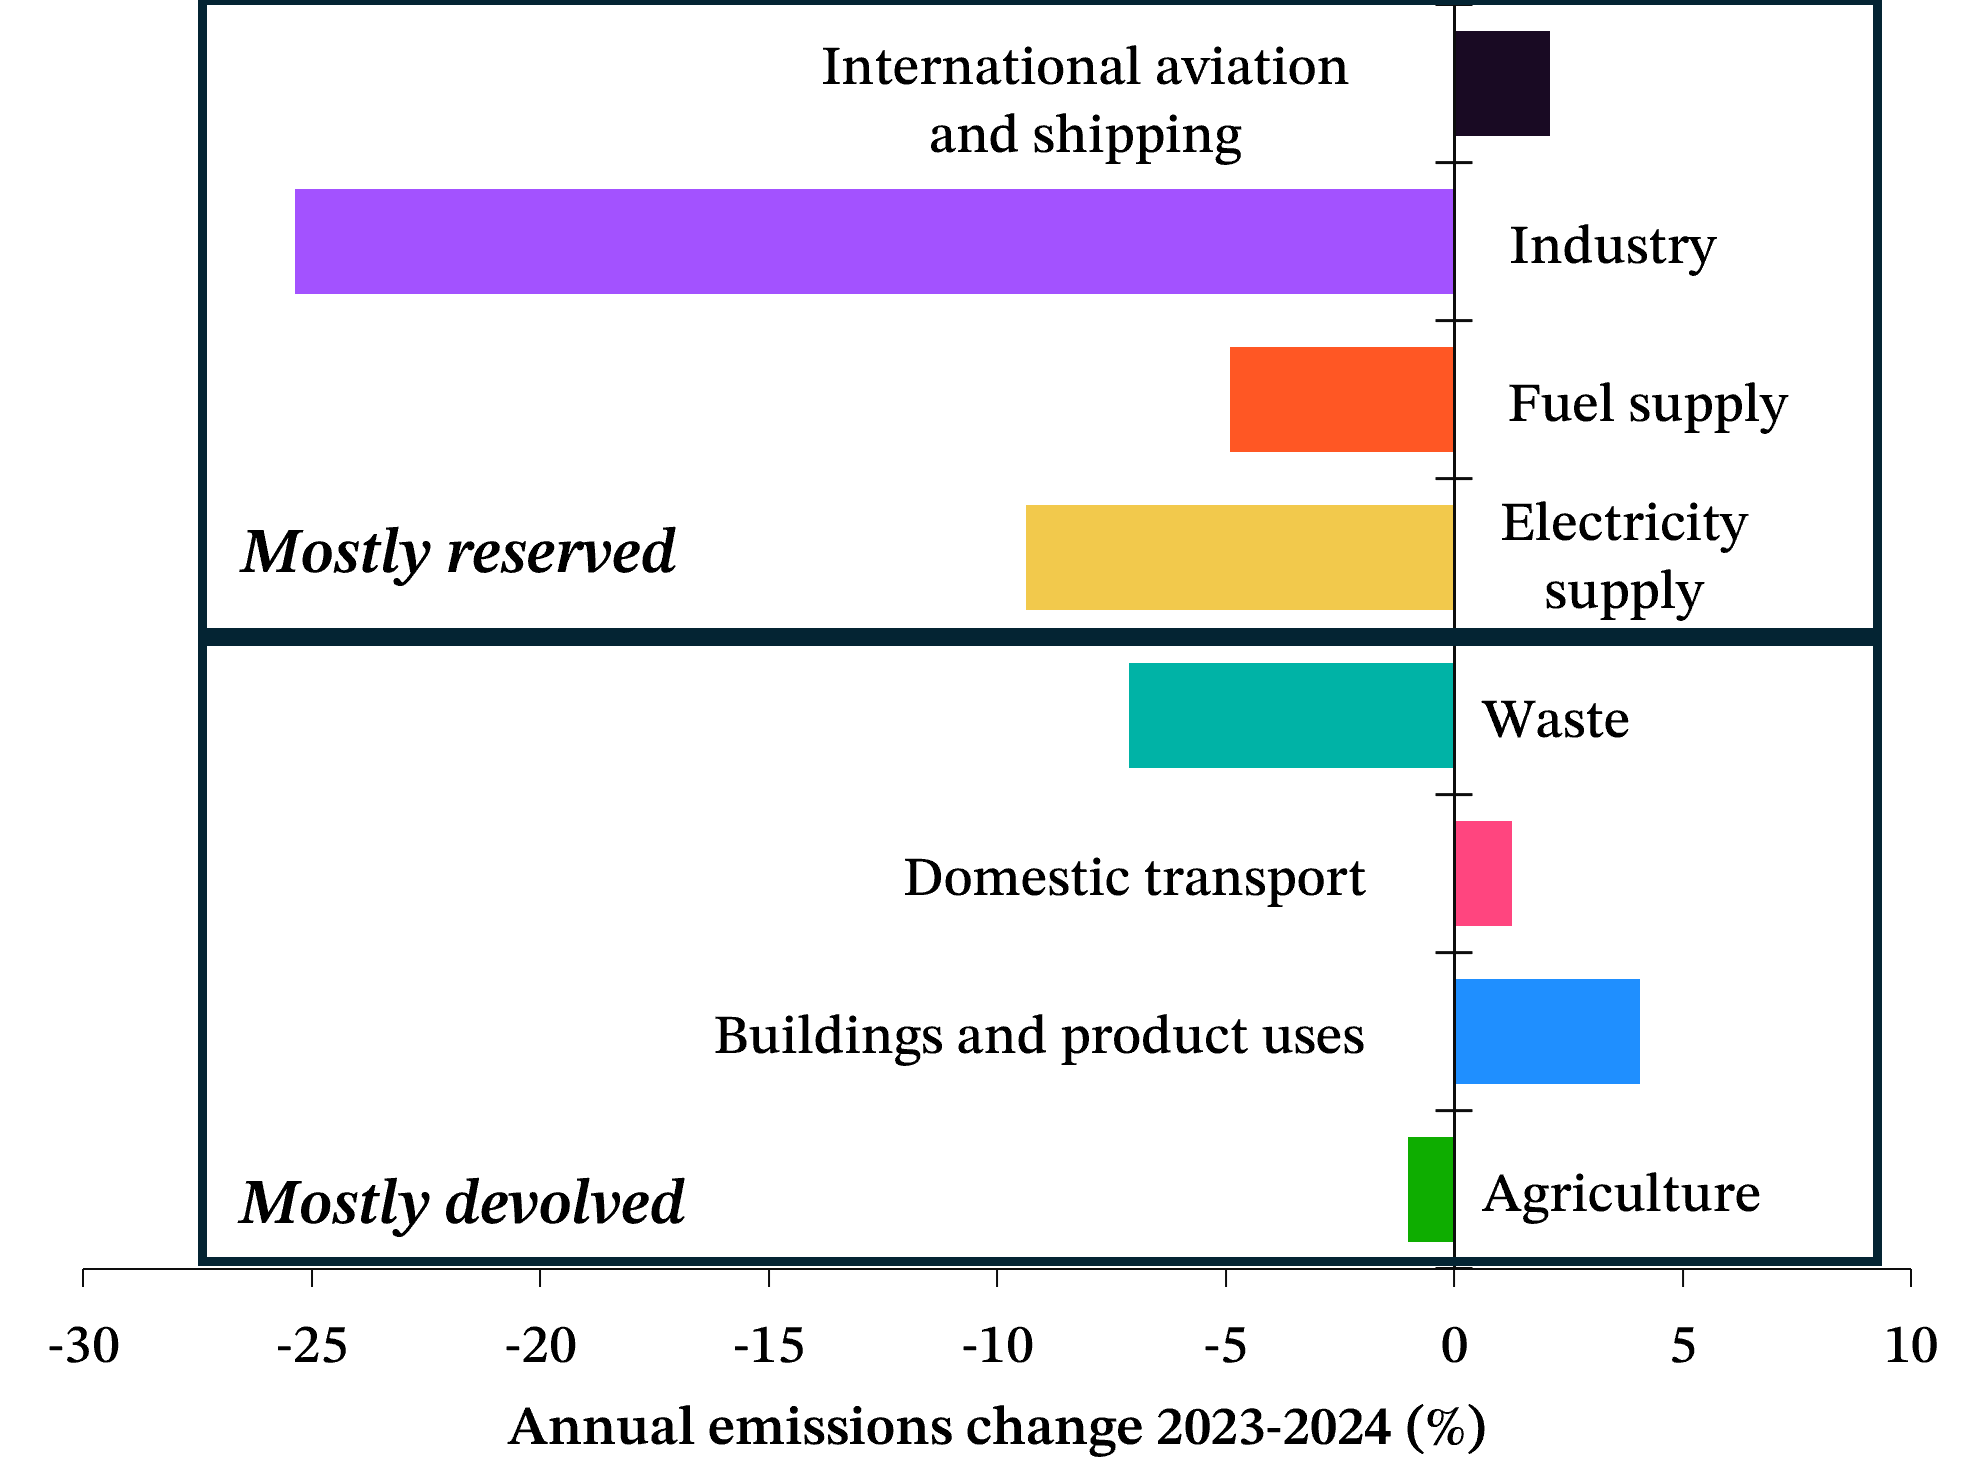
Source: Senedd Research analysis of NAEI data
Consumption emissions
Territorial emissions, which are analysed in this article, are relatively easy to measure and are also the basis for Wales’ statutory emissions reduction targets.
However, territorial emissions do not include emissions ‘embedded’ into imported products and services. For example, if a car was built in Germany and imported to Wales, the emissions associated with its production would only count towards Germany’s territorial emissions. Measuring progress by looking solely at territorial emissions risks rewarding the ‘offshoring’ of polluting industries, if the same products and services are still being consumed but are produced elsewhere.
Measuring ‘consumption’ emissions tries to correct this – accounting for both imported emissions, and those produced in Wales. However, there is much greater uncertainty in estimating consumption emissions compared to territorial emissions.
In 2023, the Welsh Government published an estimate of consumption emissions between 2001 and 2020.
Welsh consumption emissions were estimated to be slightly lower than territorial emissions throughout the whole 2001-2020 period. The Welsh Government attributed this to Wales’ high share of emissions-intensive manufacturing, much of which is exported. Consumption and territorial emissions both experienced similar declines over this period implying that ‘offshoring’ was not the main cause of falling emissions.
Welsh consumption and territorial emissions, 2001 to 2020
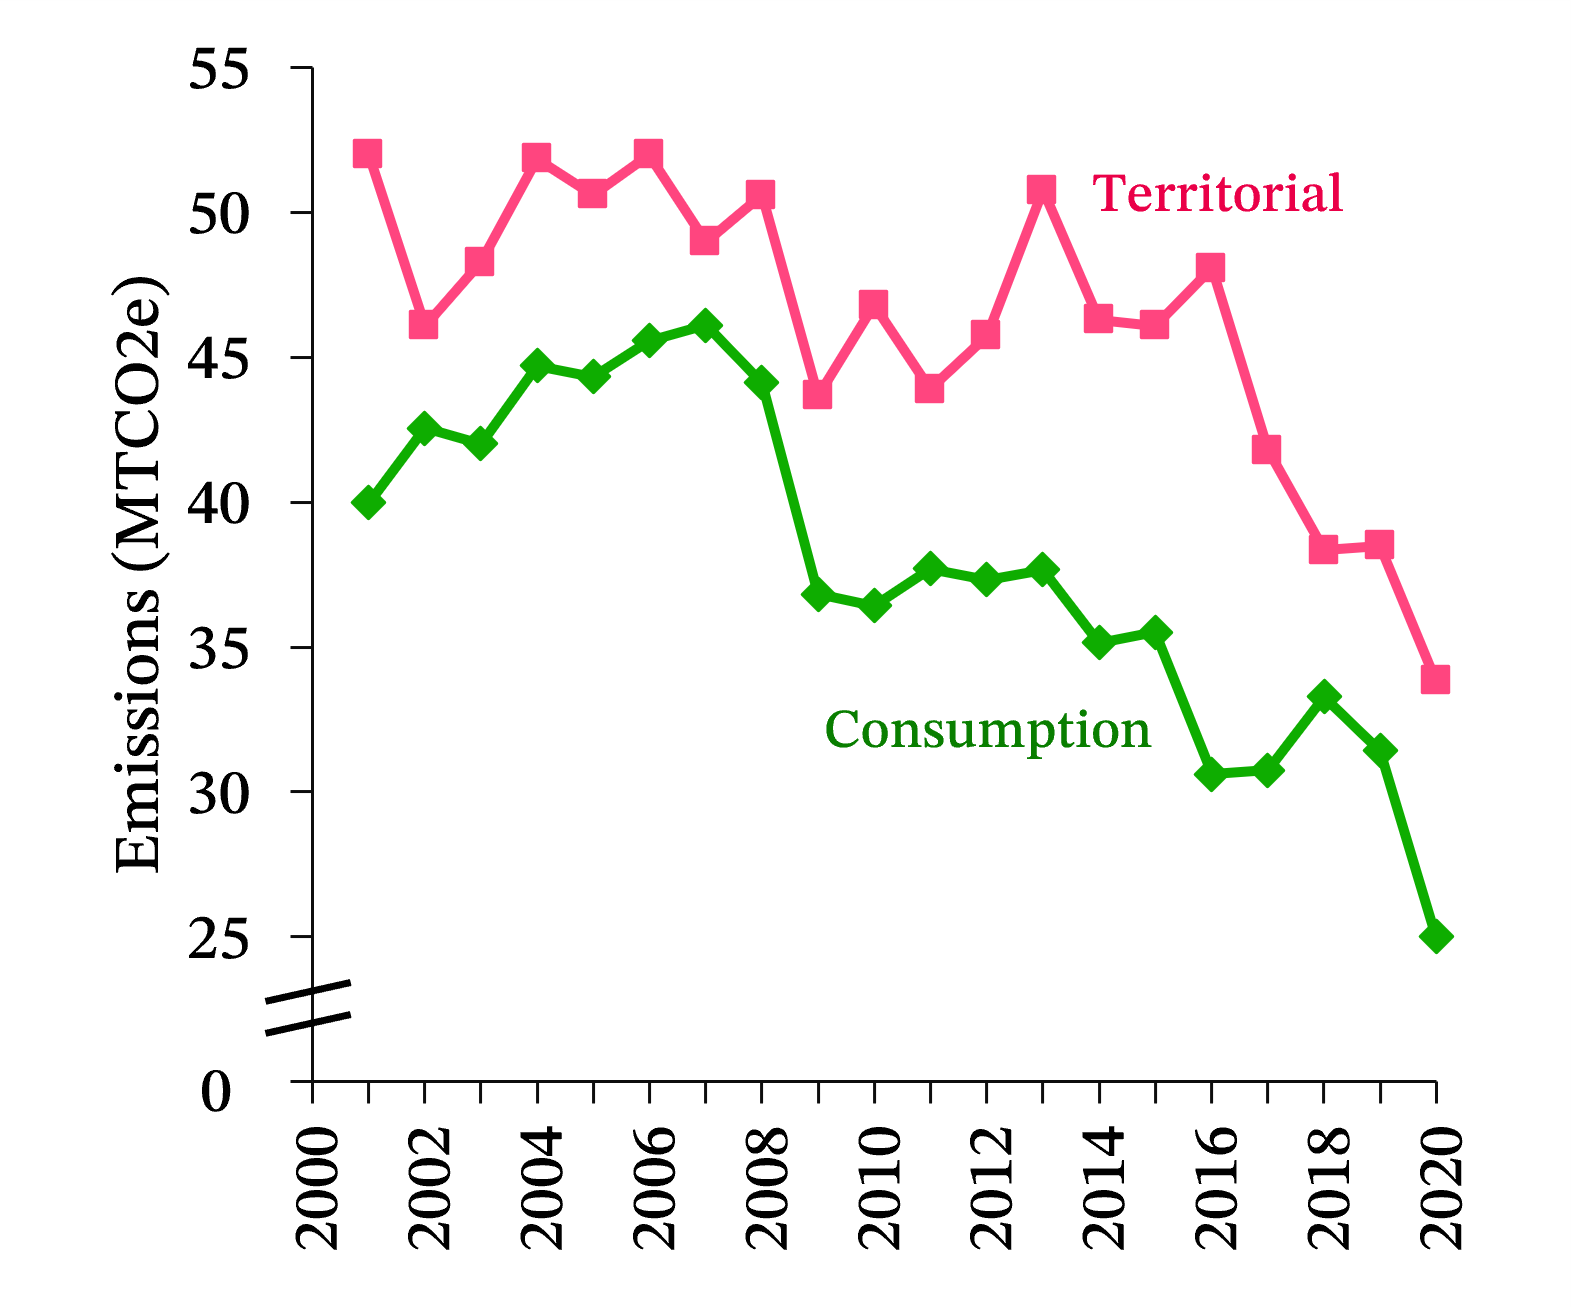
Source: NAEI, Welsh Government
The Welsh Government must publish an updated estimate of consumption emissions by the end of 2027.
What’s next?
The last Welsh Government’s Net Zero Wales plan set out its policies to deliver carbon budget 2 (2021-2025). The new Welsh Government will need to publish an equivalent plan for carbon budget 3 (2026-2030) before the end of 2026. The Welsh Government's upcoming Climate and Nature Action Plan will focus "on a practical pathway to net zero by 2040", which is 10 years earlier than the current legal target..
Port Talbot’s last blast furnace closed in September 2024, meaning the full impact on Welsh emissions will only be apparent in the 2025 data. UK-wide plans to accelerate renewable energy and new nuclear power, will likely lower emissions in the reserved electricity supply sector.
In devolved sectors, the new Sustainable Farming Scheme includes incentives for farmers to reduce emissions and increase on-farm carbon storage. The Welsh Government encourages building decarbonisation through schemes including Warm Homes Nest, Green Homes Wales, and the Energy Service. It is also developing its own renewable energy projects through the company Trydan Gwyrdd Cymru.
The CCC’s 2025 advice highlighted that future decarbonisation will become increasingly dependent on policy action in devolved sectors, such as agriculture, land use, and transport. The Welsh Government is therefore likely to bear a growing responsibility for limiting Wales’ contribution to climate change.
Territorial emissions data for 2025 is expected to be published in June 2027.
Article by Dr Matthew Sutton, Senedd Research, Welsh Parliament
