
Senedd committees are a powerful part of Welsh democracy. They check and challenge the actions of the Welsh Government, scrutinise draft laws, and engage directly with citizens. Their reports, recommendations, and legislative changes can have a real impact on how the Government and other public bodies run public services, how public money is spent, and what laws people are subject to.
How do committees do their work?
Committees rely on evidence from a range of people and organisations to do their work. It helps them to decide which issues to investigate, where problems might be, and what solutions might work.
Committees usually run consultations when they are undertaking inquiries or scrutinising draft laws and budgets. Anyone can respond to these consultations in writing, or other formats like video or audio. Committees also invite certain people and organisations to give oral evidence during committee meetings, in person or remotely.
Evidence gathered through consultations, committee meetings, and citizen engagement activities like field visits, focus groups and surveys, alongside research conducted by Senedd Research or from expert advisers, helps committees to reach conclusions, come up with ideas for change, and write reports.
Why monitor the diversity of committee evidence?
Understanding which people and organisations give evidence to committees can help identify missing voices and barriers to engagement.
In 2021, the Senedd committee chairs recommended that data should be collected on who engages with Senedd committees. The 2021 Stirbu review into the effectiveness of Senedd committees also recommended that the diversity of committee evidence should be monitored.
‘Diversity’ can mean many different things. The Senedd states that it wants to make sure that the “evidence used by Senedd committees comes from a diverse and inclusive range of people, communities, sectors, groups and organisations - especially those that are affected by an issue under consideration.”
What did the evidence diversity monitoring pilot project find?
From November 2021 until April 2022 Senedd committees ran a pilot project to monitor the diversity of committee evidence. This was done in two ways:
- Analysis of data collected through the Senedd Business Management System (SBMS) (an internal administrative system) over a three-year period, but only for witnesses providing oral evidence; and
- A voluntary survey sent to people contributing evidence to committees (including written evidence, oral evidence, and engagement activities). Different surveys were piloted by different committees. The response rate to the surveys was 18%, meaning that any conclusions should be treated with caution.
The data showed:
- The vast majority (89%) of respondents to the survey contributed their evidence remotely. 75% contributed evidence in English only, 13% contributed evidence in both English and Welsh, and just over 10% in Welsh only (or preferred not to say).
- Most survey respondents had taken part in committee work before, either occasionally or once (40%) or frequently (15%). But the SBMS data indicates that over the three-year period, the vast majority of oral witnesses attended committee only once in each year (over 70%).
- The survey showed that the majority (74%) of respondents contributed evidence on behalf of an organisation. Of these respondents, most said their organisation had participated in committee work before, either frequently (44%), or once or occasionally (35%).
Sectoral representation
The following graph shows the share of survey responses for each sector and highlights differences with the SBMS data.
Survey responses by sector (click on a bullet point or block on the graph)
|
■ 33% of survey respondents giving evidence in a professional capacity or on behalf of an organisation said they represented the public sector. According to SBMS data, the public sector represented around a third of oral witnesses (excluding Welsh Government representatives) in 2021-22. ■ The third/voluntary sector is also well represented. 32% of professional or organisation survey responses came from this sector, and SBMS data shows they made up around 20% of oral witnesses (an increase from around 10% in 2019-20). ■ Academics comprised under 9% of survey respondents, and made up 10% of oral witnesses in 2021-22 (a decline from 13% in 2019-20) ■ Professional bodies and trade unions represented 8% of the survey responses, and made up 12% of witnesses. ■ Welsh Government representatives (Ministers and officials) made up fewer than 5% of survey responses. However, they represented more than a quarter of oral witnesses according to SBMS. ■ The private sector had low representation in committee evidence. The survey data showed that under 5% of evidence came from this sector. As a reference point, 70% of the Welsh workforce is employed in the private sector. ■ 10% of evidence came from other sources including: industry bodies or regulators; public affairs bodies; campaign or community groups; representatives of youth groups, school pupils or students, or Member of the Welsh Youth Parliament; and individuals. |
|---|
Figures are rounded. Values under 5% are not shown for disclosure control. Box sizes are approximate for the groups Welsh Government representatives, private sector and others.
Geographic representation
The graph below shows the percentage of survey respondents by area of residence. Comparison with the percentage of the Wales population indicates whether areas are over or under represented.
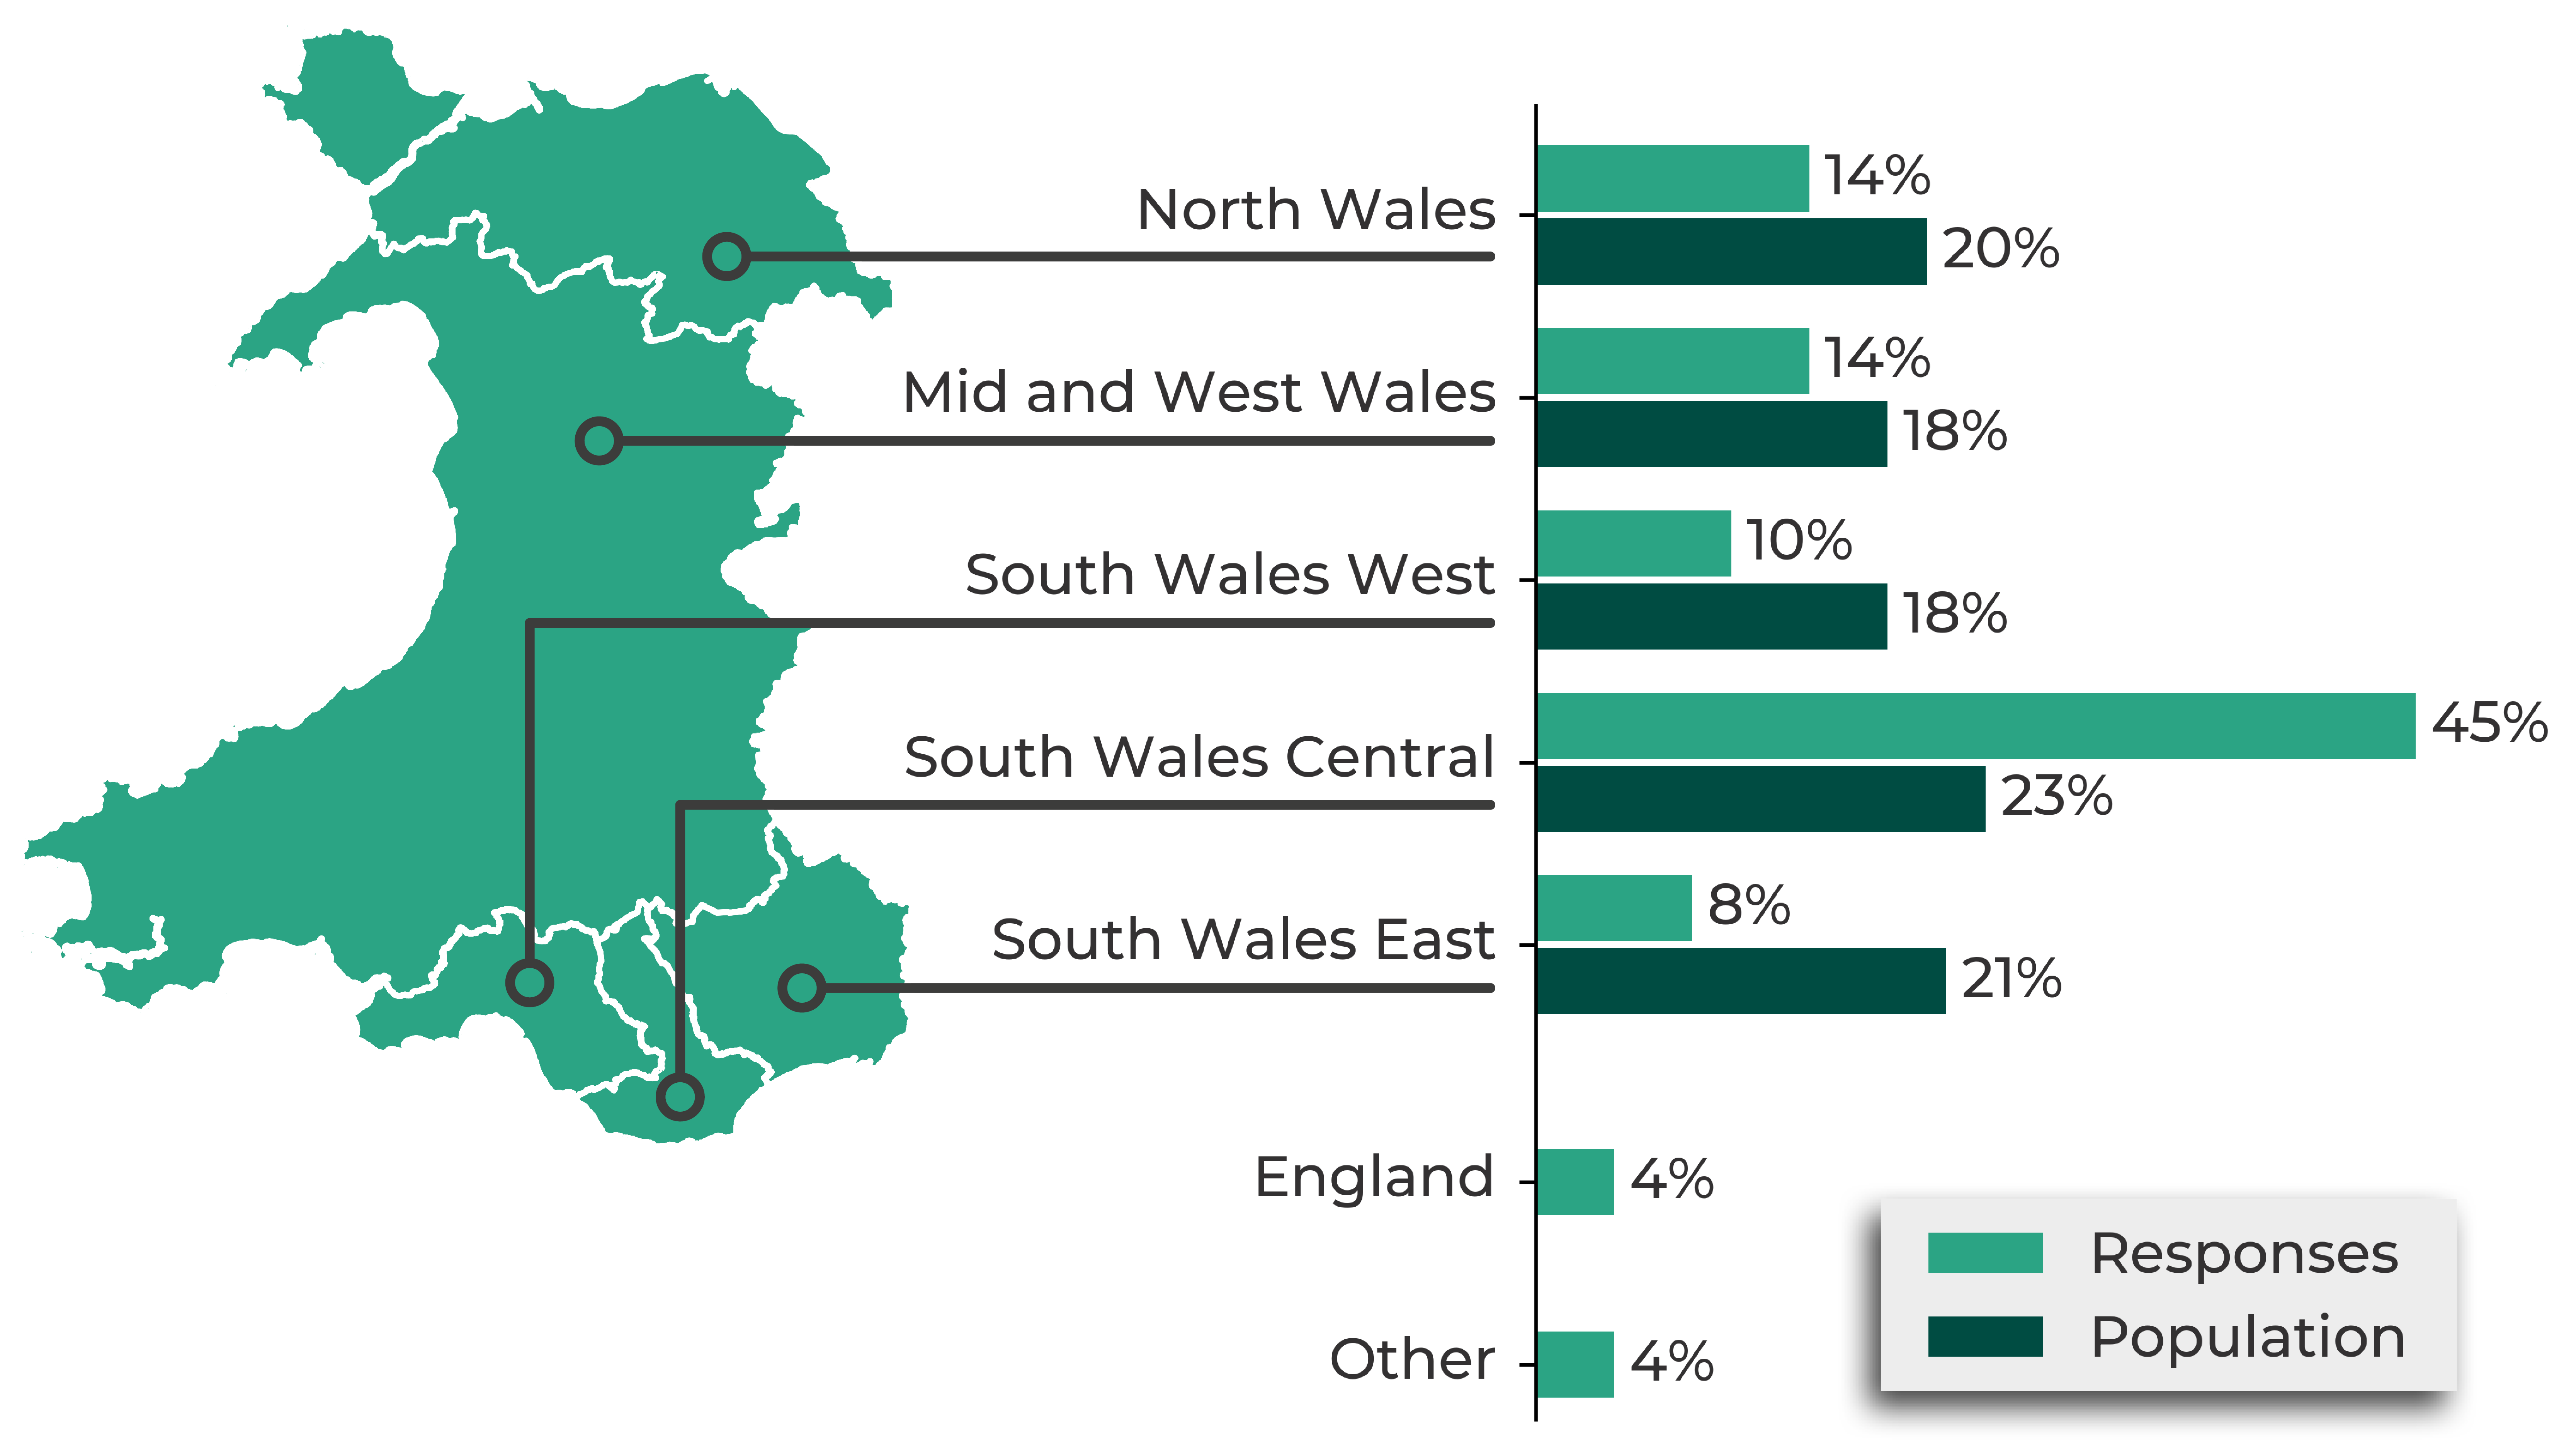
Source: Data for the Senedd Cymru constituency areas: 2021.
'Other' includes Scotland, outside the UK, and preferred not to say.
Demographic representation
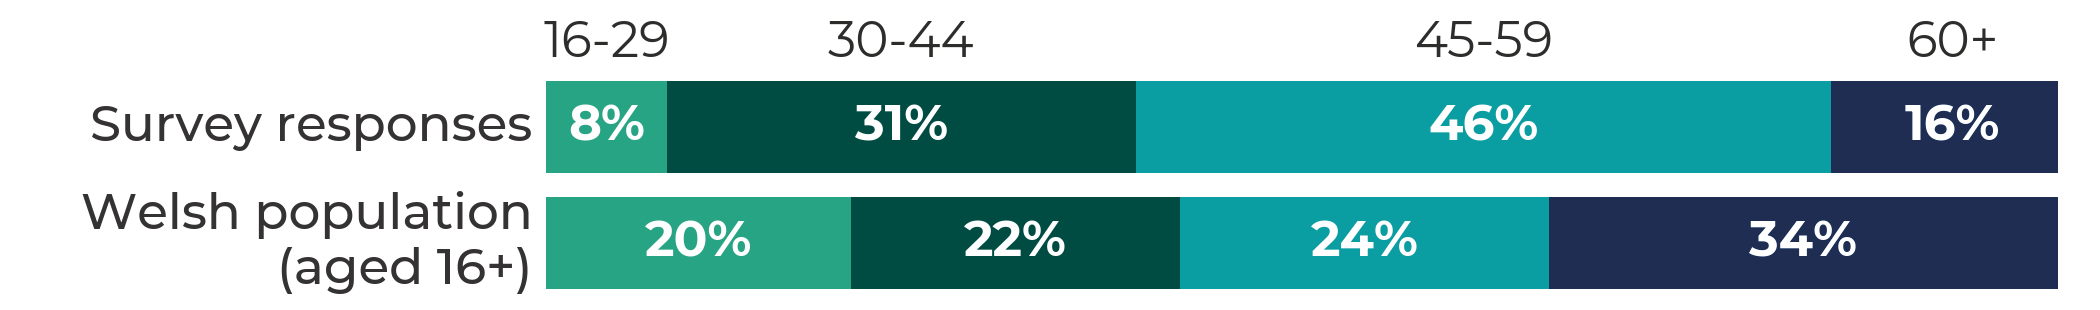
Compared with population data, the survey data showed an under-representation of younger people (under 30) and people over 60, which is likely a reflection of the fact that most people were responding in a professional capacity, of working age, and at a more advanced point in their career.
More than 55% of survey respondents identified themselves as female, compared to the Welsh population which is 51% female.
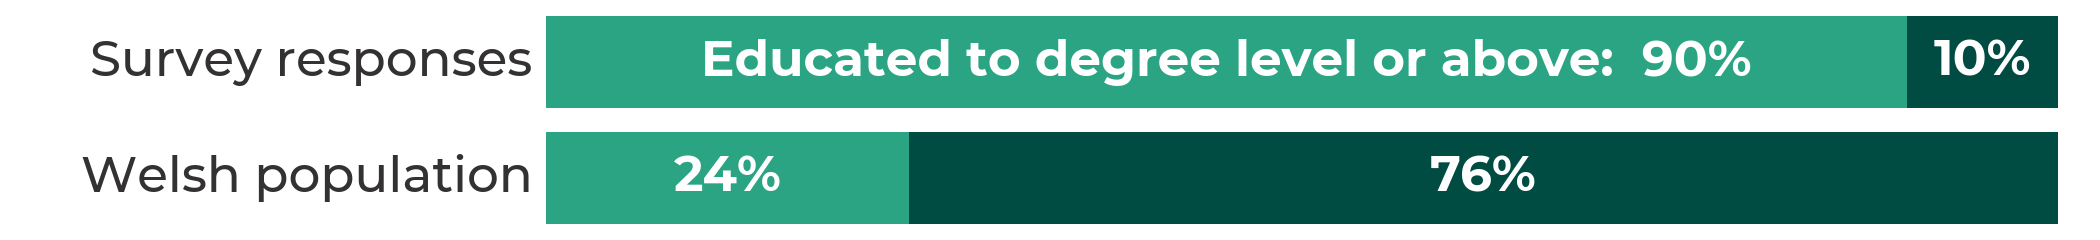
Two of the pilot surveys asked about education, employment and socioeconomic background. 90% of survey respondents were educated to degree level or above, compared with 24% of the Welsh population.
There was also an over-representation of people working full-time compared with the Welsh population (58% compared with 37%). 80% of survey respondents did not consider themselves to come from a disadvantaged background.
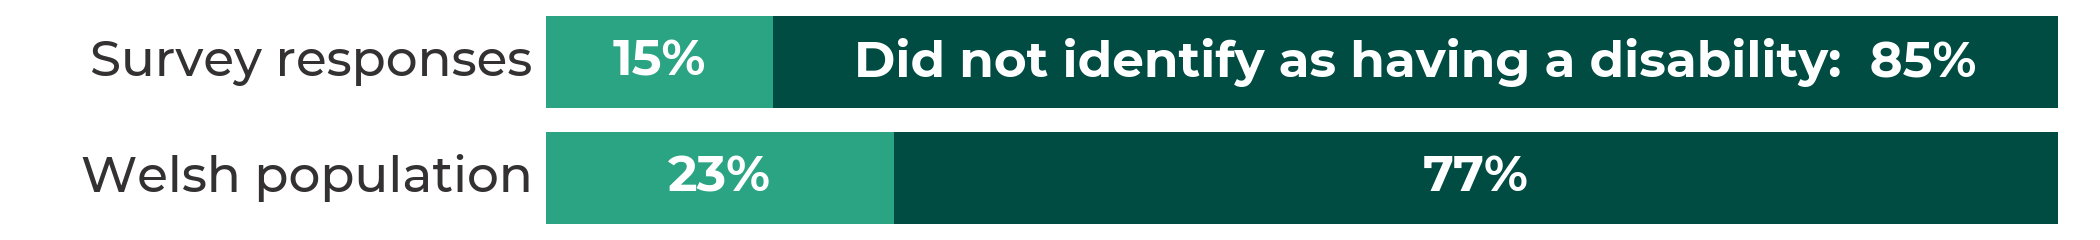
Fewer than 15% of survey respondents identified as having a disability, compared with 23% of the Welsh population.
Excluding those who preferred not to say, 55% of survey respondents had no religion, and 36% were Christian. In contrast, 47% of the Welsh population had no religion and 44% were Christian.
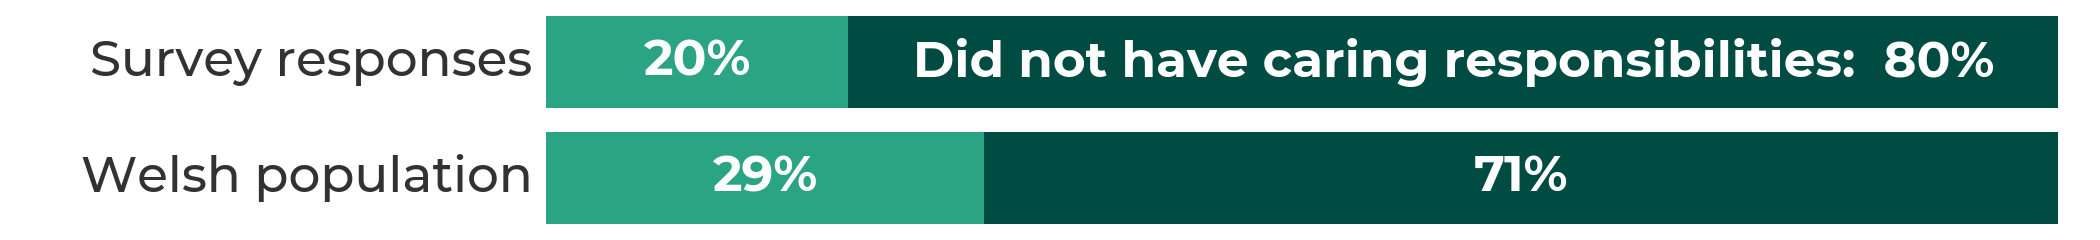
Two of the pilot surveys asked about responsibilities for caring as a result of physical or mental health or old age. 20% of survey respondents said they had caring responsibilities, whereas research indicates that 29% of the Welsh population care for someone.
In terms of sexual orientation, gender identity, national identity, and ethnic group, there did not appear to be any significant under-representation compared with the Welsh population as a whole.
Nearly half of respondents lived in the south Wales central region, so respondents are likely to more closely reflect the demographics of this region.
Unless otherwise stated, the above comparisons are made using the most recently available Census data, either from 2011 (for education, disability, sexual orientation, gender identity, and national identity), or 2021 (for age, sex, working pattern, religion, and ethnic group). Values under 5% are not shown for disclosure control.
The experience of giving evidence
The majority of survey respondents asked about their experience of contributing to committee work were satisfied, including with the notice they were given, the opportunity to give their views, help from staff, and their overall experience. 95% said it was 'likely' or 'very likely' that they would take part in committee work again given the chance.
What next?
A second pilot of the evidence diversity monitoring system began in November 2022. Most people engaging with Senedd committees will be invited to complete the survey.
The data will also help committees to understand the impact of changes to their processes since the pandemic, particularly the continuing use of remote evidence.
A range of work is being explored and undertaken internally to make sure that everyone is able to take part in the work of committees, including new guidance and training.
You can read more about the pilot in the FAQs.
Article by Hannah Johnson and Joe Wilkes, Senedd Research, Welsh Parliament