Article by Ben Stokes, National Assembly for Wales Research Service
Yesterday morning the Office for National Statistics published the latest estimates of UK regional and sub-regional Gross Value Added (GVA). GVA is a measure of the increase in the value of the economy due to the production of goods and services. These regional estimates of GVA are measured using the income approach, which involves adding up the income generated by resident individuals or businesses in the production of goods and services. These statistics are important as they provide an overview of economic performance at regional and sub-regional level, allowing comparison between the countries and regions of the UK. Also, GVA per head estimates are one of the outcome indicators for the Growth and Jobs chapter of the Welsh Government’s Programme for Government. The figures are produced at three levels of geography using the EU standard Nomenclature of Units of Territorial Statistics (NUTS) approach.
- NUTS1: 12 areas - Wales, Scotland, Northern Ireland and the nine English regions.
- NUTS2: 37 areas or sub-regions – mainly groups of counties and unitary authorities.
- NUTS3: 139 areas – mainly individual counties and unitary authorities (also known as local areas)
For the first time NUTS1 GVA estimates have been produced both on a workplace basis (allocated to the location where the economic activity takes place) and on a residence basis (earnings of individuals are allocated to the region in which they live). The latest estimates of the NUTS2 and NUTS3 data have only been produced on a workplace basis. Key points from the data include:
- In 2012, of the 12 NUTS1 regions, Wales had the third largest increase in workplace based GVA per head at 1.6 per cent, behind the North West (1.7 per cent) and the South East (2.5 per cent).
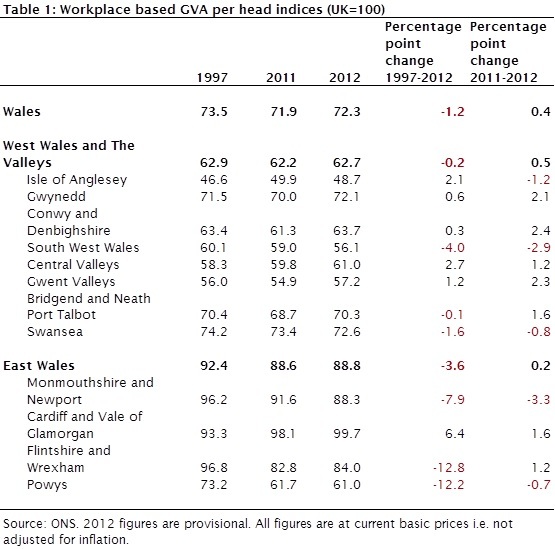
- Workplace based GVA per head in Wales in 2012 stood at £15,401, or 72.3 per cent of the UK average (an increase of 0.4 percentage points on 2011, relative to the UK average).
- Residence based GVA per head in Wales was £15,799, or 74.0 per cent of the UK average (an increase of 0.5 percentage points on 2011, relative to the UK average).
- On both the workplace and residence bases GVA per head in Wales in 2012 was the lowest of all the 12 NUTS1 regions of the UK.
- At the NUTS2 level, GVA per head in East Wales stood at 88.8 per cent of the UK average, an increase of 0.2 percentage points on 2011. While GVA per head in West Wales and the Valleys in 2012 was 62.7 per cent of the UK average, an increase of 0.5 percentage points on 2011.
- Relative to the UK average, GVA per head in West Wales and the Valleys in 2012 was the second lowest of all the NUTS2 areas in Wales, England and Northern Ireland. (equivalent NUTS2 and NUTS3 data for Scotland has not been published as yet)
- Relative to the UK average, the Isle of Anglesey recorded the lowest GVA per head of all the NUTS3 areas in Wales, England and Northern Ireland in 2012, with a figure of 48.7 per cent.
Table 1 shows the changes in workplace based GVA per head for Wales, and the NUTS2 and NUTS3 areas of Wales, relative to the UK average, over the full time period for which these figures are available. Negative changes are shown in red.  Next week (18 December) the ONS will be publishing experimental ‘real-terms’ GVA estimates for the first time, down to the NUTS2 level and for the period 1997-2011. These estimates will take account of inflation, which the current estimates do not. They will not give the same headline results as the main GVA release published yesterday as they are produced using different methods; headline GVA is income based, this new and experimental estimate uses the production method. Further information is available here.


