Greenhouse gas (GHG) emissions are the primary cause of climate change. These gases are released from a variety of activities central to modern life – from combustion engine vehicles, to generating electricity, and farming.
This article uses the latest Welsh GHG emissions statistics to explore major sources and trends in emissions between 1990 and 2023.
Background
Wales legally committed to net zero GHG emissions by 2050 through a 2021 amendment to the Environment (Wales) Act 2016. The Act also requires the Welsh Government to gradually reduce emissions in two ways: interim emissions reduction targets for 2020, 2030, and 2040; and cumulative five-year carbon budgets, starting with carbon budget 1 (2016-2020).
Annual territorial emissions data for UK nations are published by the UK National Atmospheric Emissions Inventory (NAEI). Collating and verifying the data takes time, so the June 2025 data release relates to territorial emissions up to 2023. Territorial emissions include all emissions within Wales, but exclude emissions embedded into products and services imported into the country from the rest of the UK and overseas. An alternative emissions metric using estimated ‘consumption’ is explored at the end of this article.
Emissions reductions are measured relative to a ‘baseline’ year – which is 1990 for the most common greenhouse gases, such as carbon dioxide, and 1995 for some uncommon but more powerful greenhouse gases. Emissions are measured in kilotonnes carbon dioxide equivalent (kTCO2e), allowing gases with different warming potentials to be directly compared.
Total emissions in 2023
Wales’ absolute emissions are small in the global context. Its 34,084 ktCO2e in 2023, makes up less than 0.1% of the worldwide total. However, adjusting for its population, Welsh emissions are 10.8 TCO2e per-person, giving it the highest per-person emissions of any UK nation, and a per-person footprint 65% higher than the global average.
National and international per-person GHG emissions

Source: NAEI, Office for National Statistics, United Nations, European Commission.
As one of the first countries in the world to industrialise, Wales’ historic contribution to climate change is also higher than most similarly-sized nations.
Emissions are falling over time
Up to 2023, total Welsh emissions have fallen by 38% compared to the baseline year. The Welsh Government achieved its first carbon budget (2016-2020) and 2020 interim target with an average emissions reduction of 27.8%.
Total emissions in 2023 were the second-lowest on record, falling by 6% compared to 2022.
Welsh territorial emissions, targets, and carbon budgets, 1990 to 2050

Source: NAEI, Welsh Government, Climate Change Committee
The Welsh Government is currently on-track to achieve the 2021-2025 carbon budget. A further 40% reduction from 2023 emissions will be required to meet the 2030 interim target.
The Welsh Government must set the level of carbon budget 4 (2031-2035) in regulations before the end of 2025. The UK Climate Change Committee (CCC), an independent statutory advisory body, recently advised it to set a target level 73% lower than the baseline year.
Where do Wales’ emissions come from?
Sources of greenhouse gases are diverse. Looking sector-by-sector, industry was the largest source of emissions in Wales in 2023, followed by domestic transport, agriculture, and electricity supply.
2023 emissions by sector

Source: NAEI
Devolved sectors have been slower to decarbonise
The Welsh Government only has partial responsibility for reducing emissions. Some sectors are partially or fully reserved to the UK Government. This analysis divides sectors into ‘mostly reserved’ or ‘mostly devolved’ based on where policy powers lie, in line with CCC definitions.
2023 total emissions in reserved and devolved sectors

Source: NAEI
*The CCC classifies ‘surface transport’ and ‘buildings’ as ‘partially devolved’.
†Land use change, including forestry and peatland, is a net sink of greenhouse gases. Therefore this sector’s ‘emissions’ are negative.
The majority (57%) of Wales’ 2023 emissions were in reserved sectors. Reserved emissions had decreased 42% against the baseline, whilst devolved emissions had declined by 33%.
Change in reserved and devolved emissions with key events, 1990 to 2023
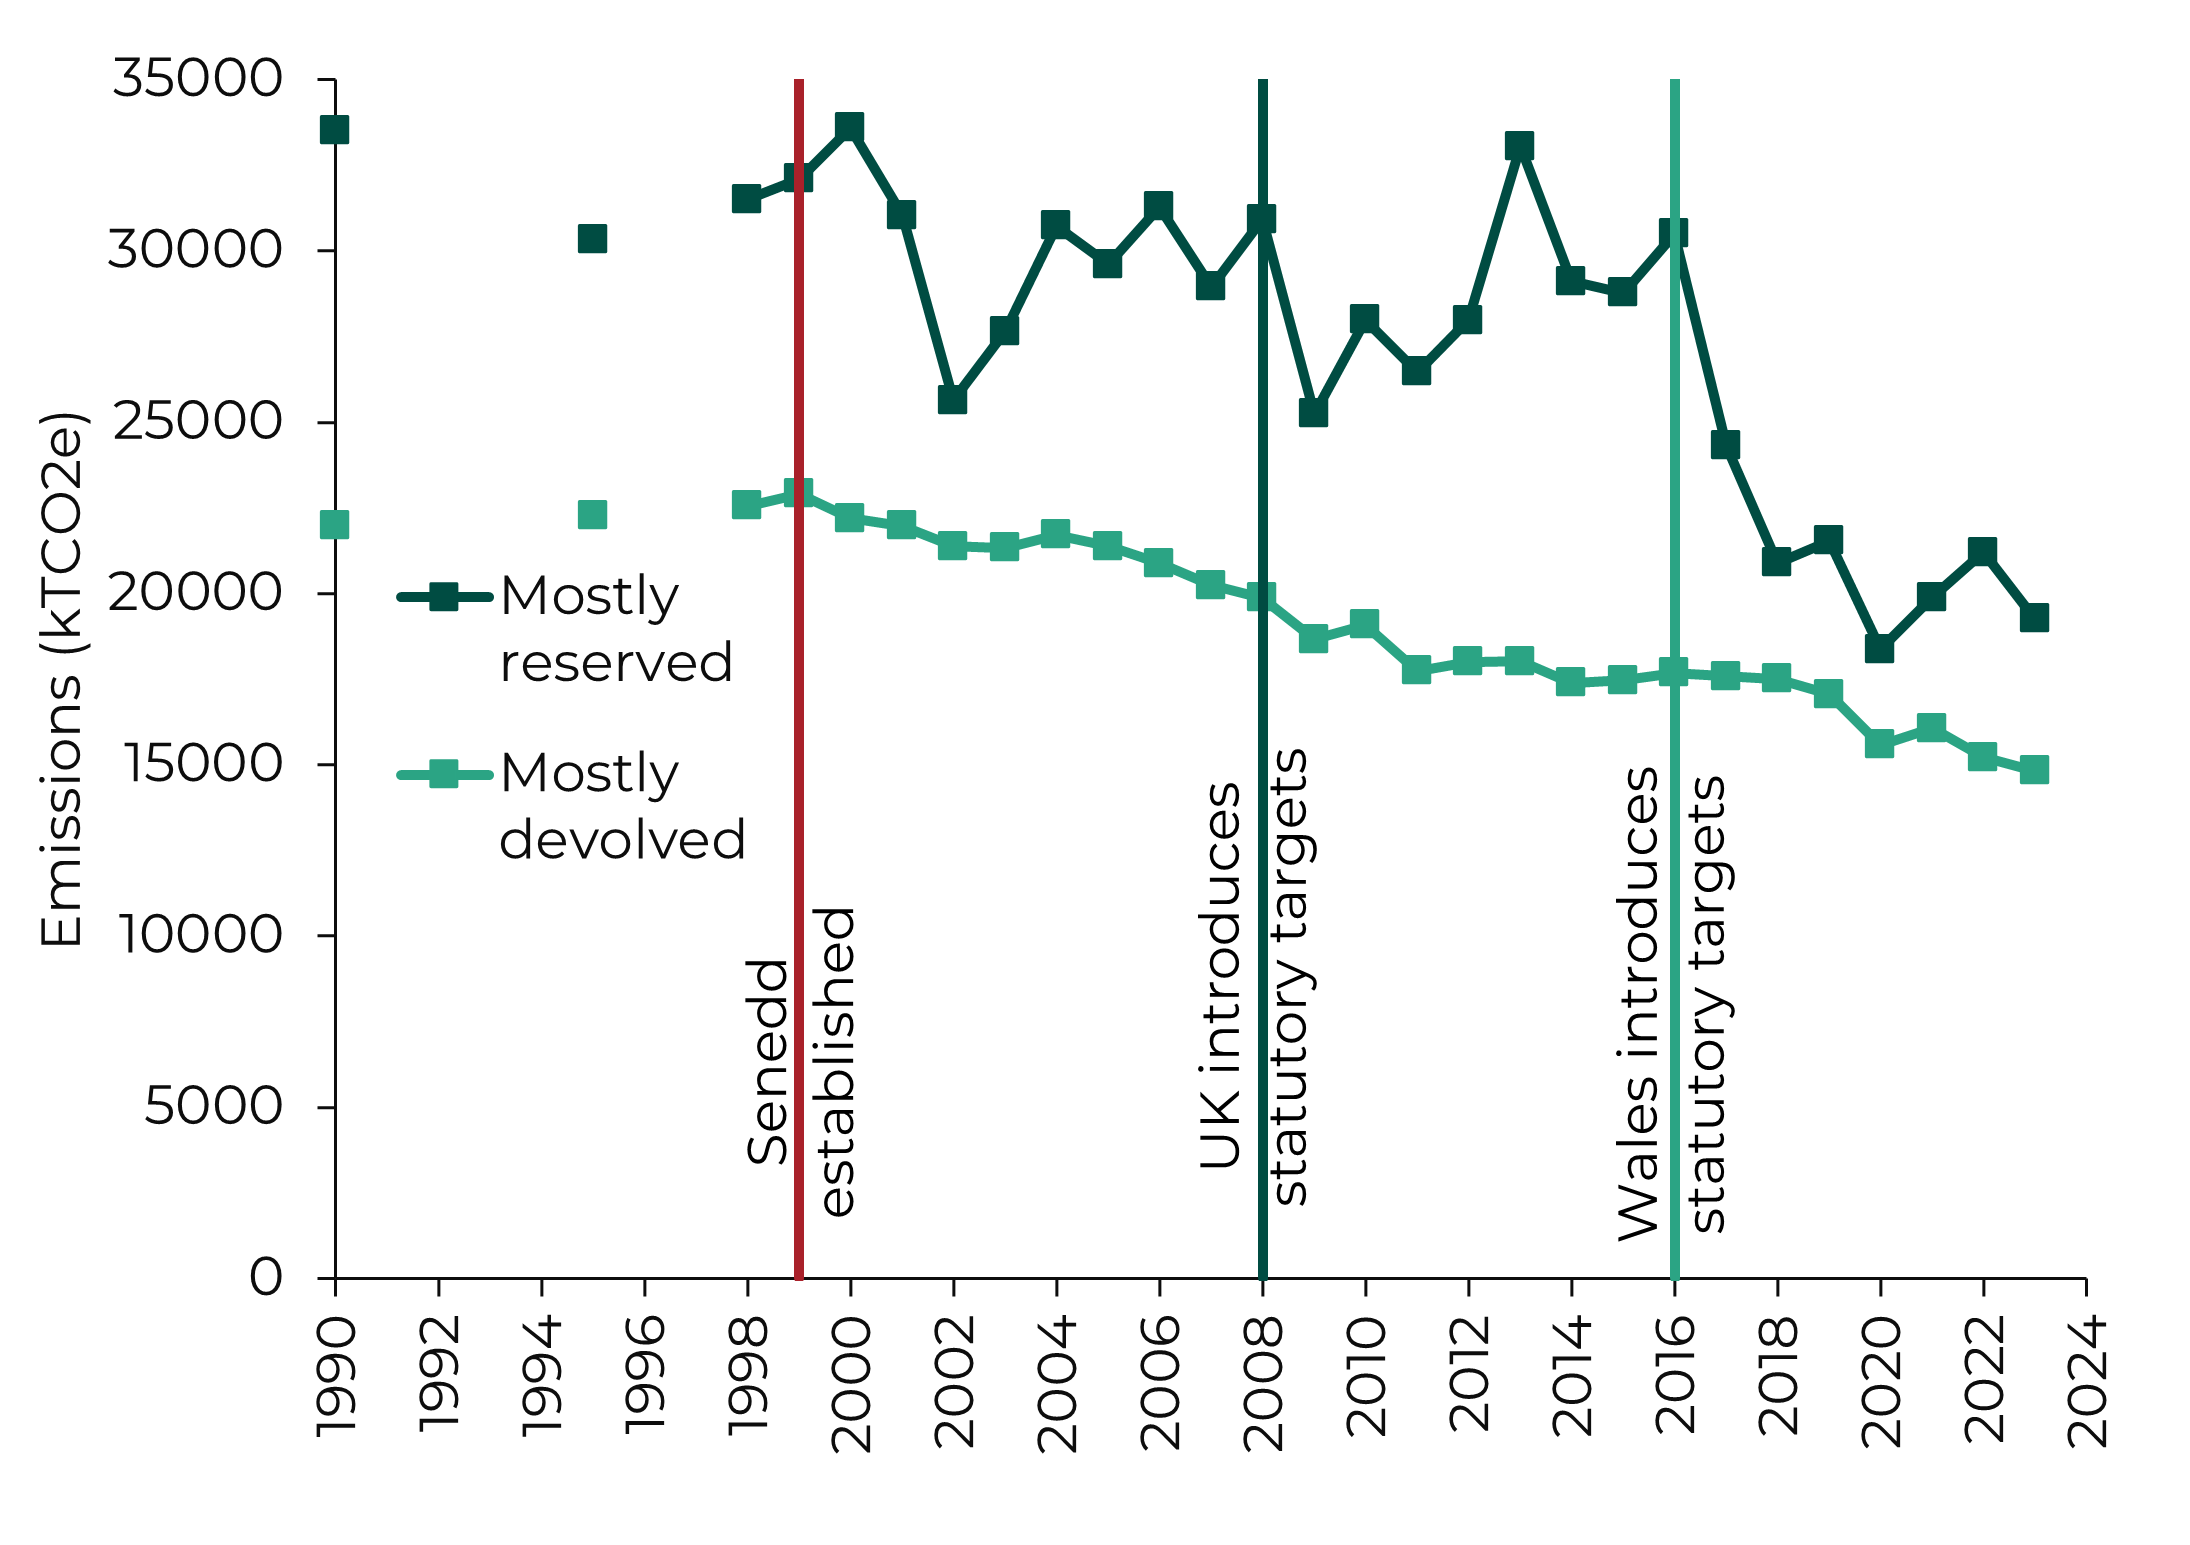
Source: NAEI, Climate Change Act 2008, Environment (Wales) Act 2016.
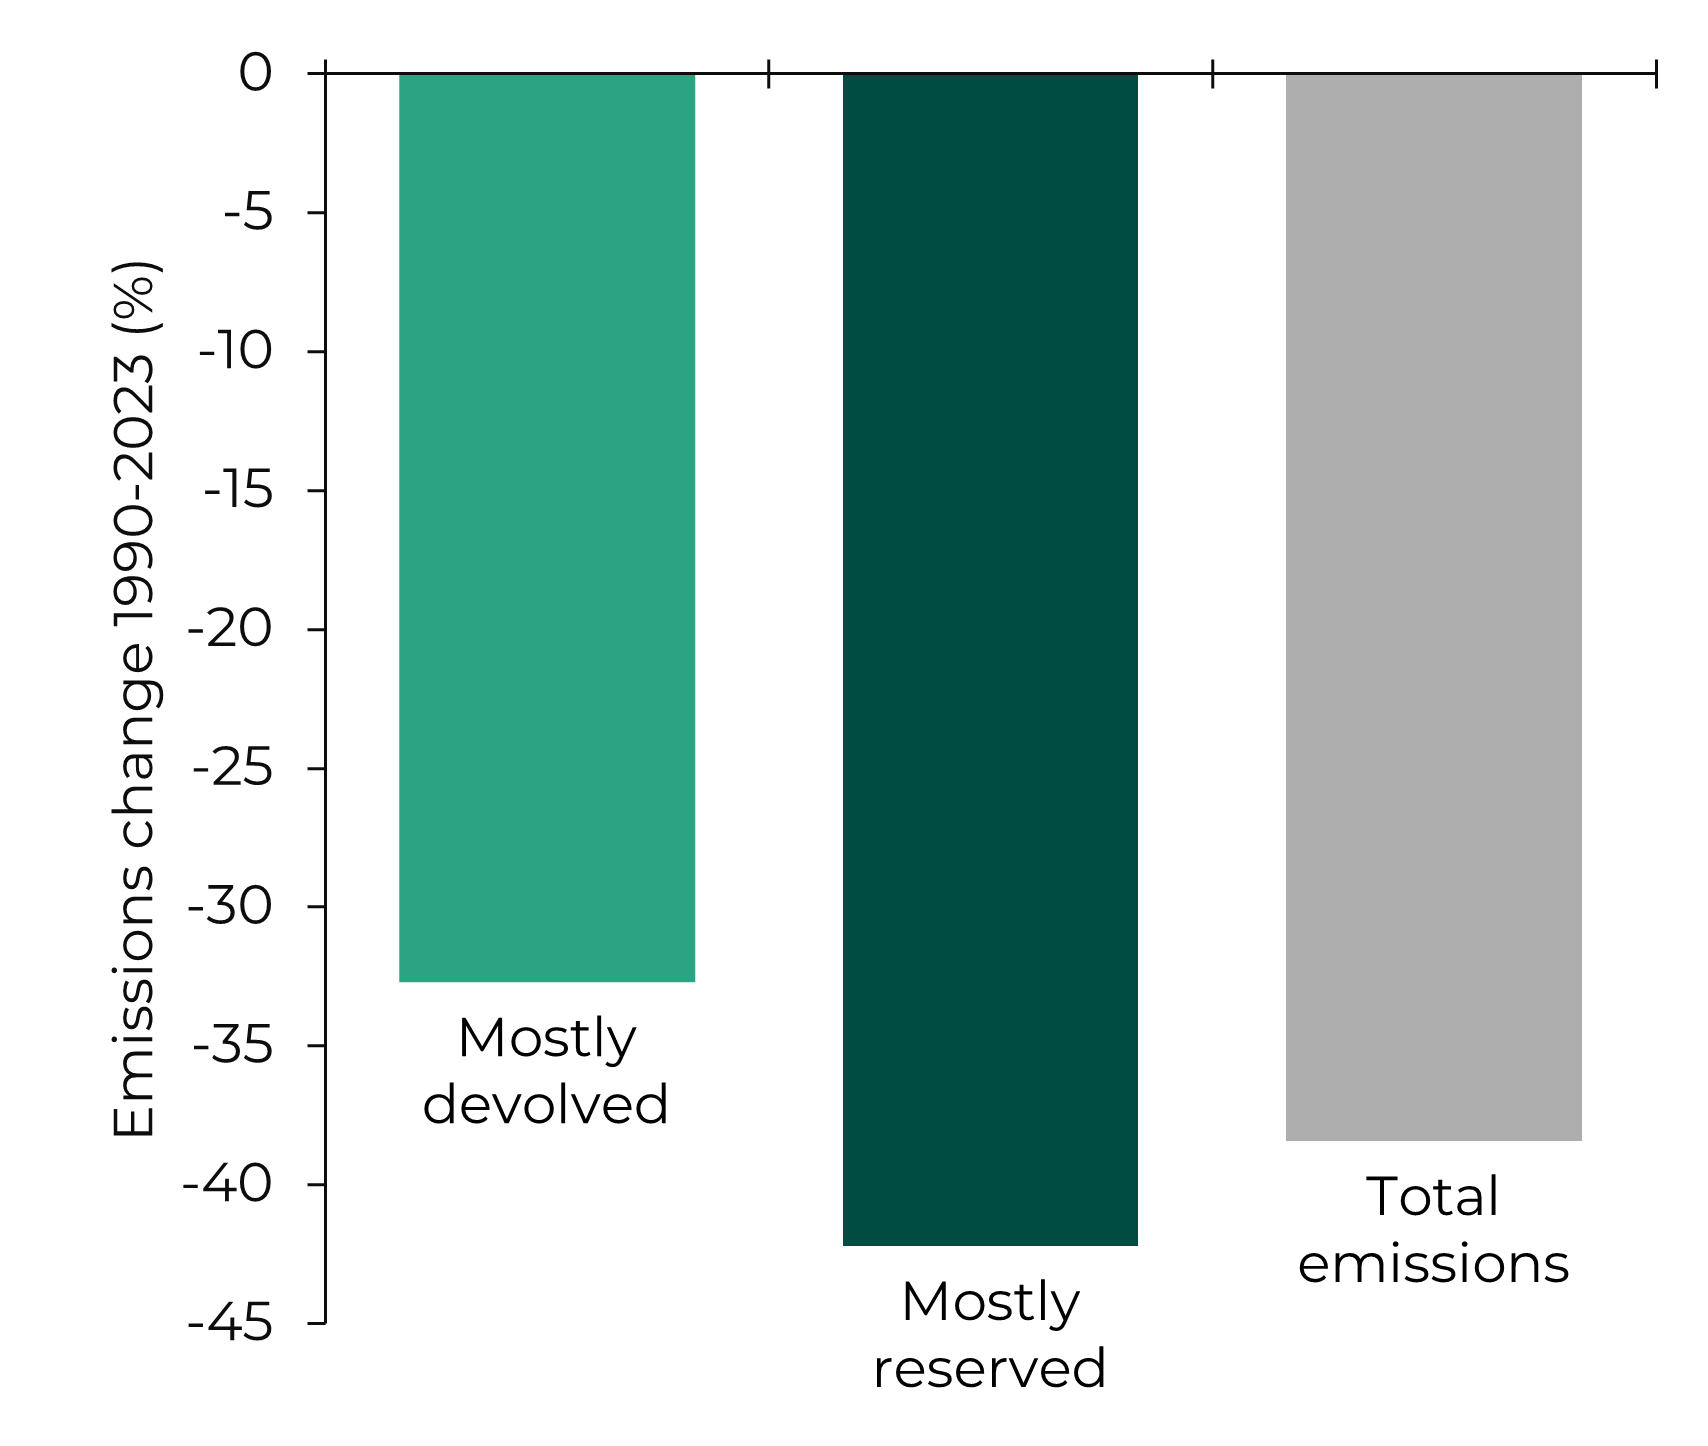
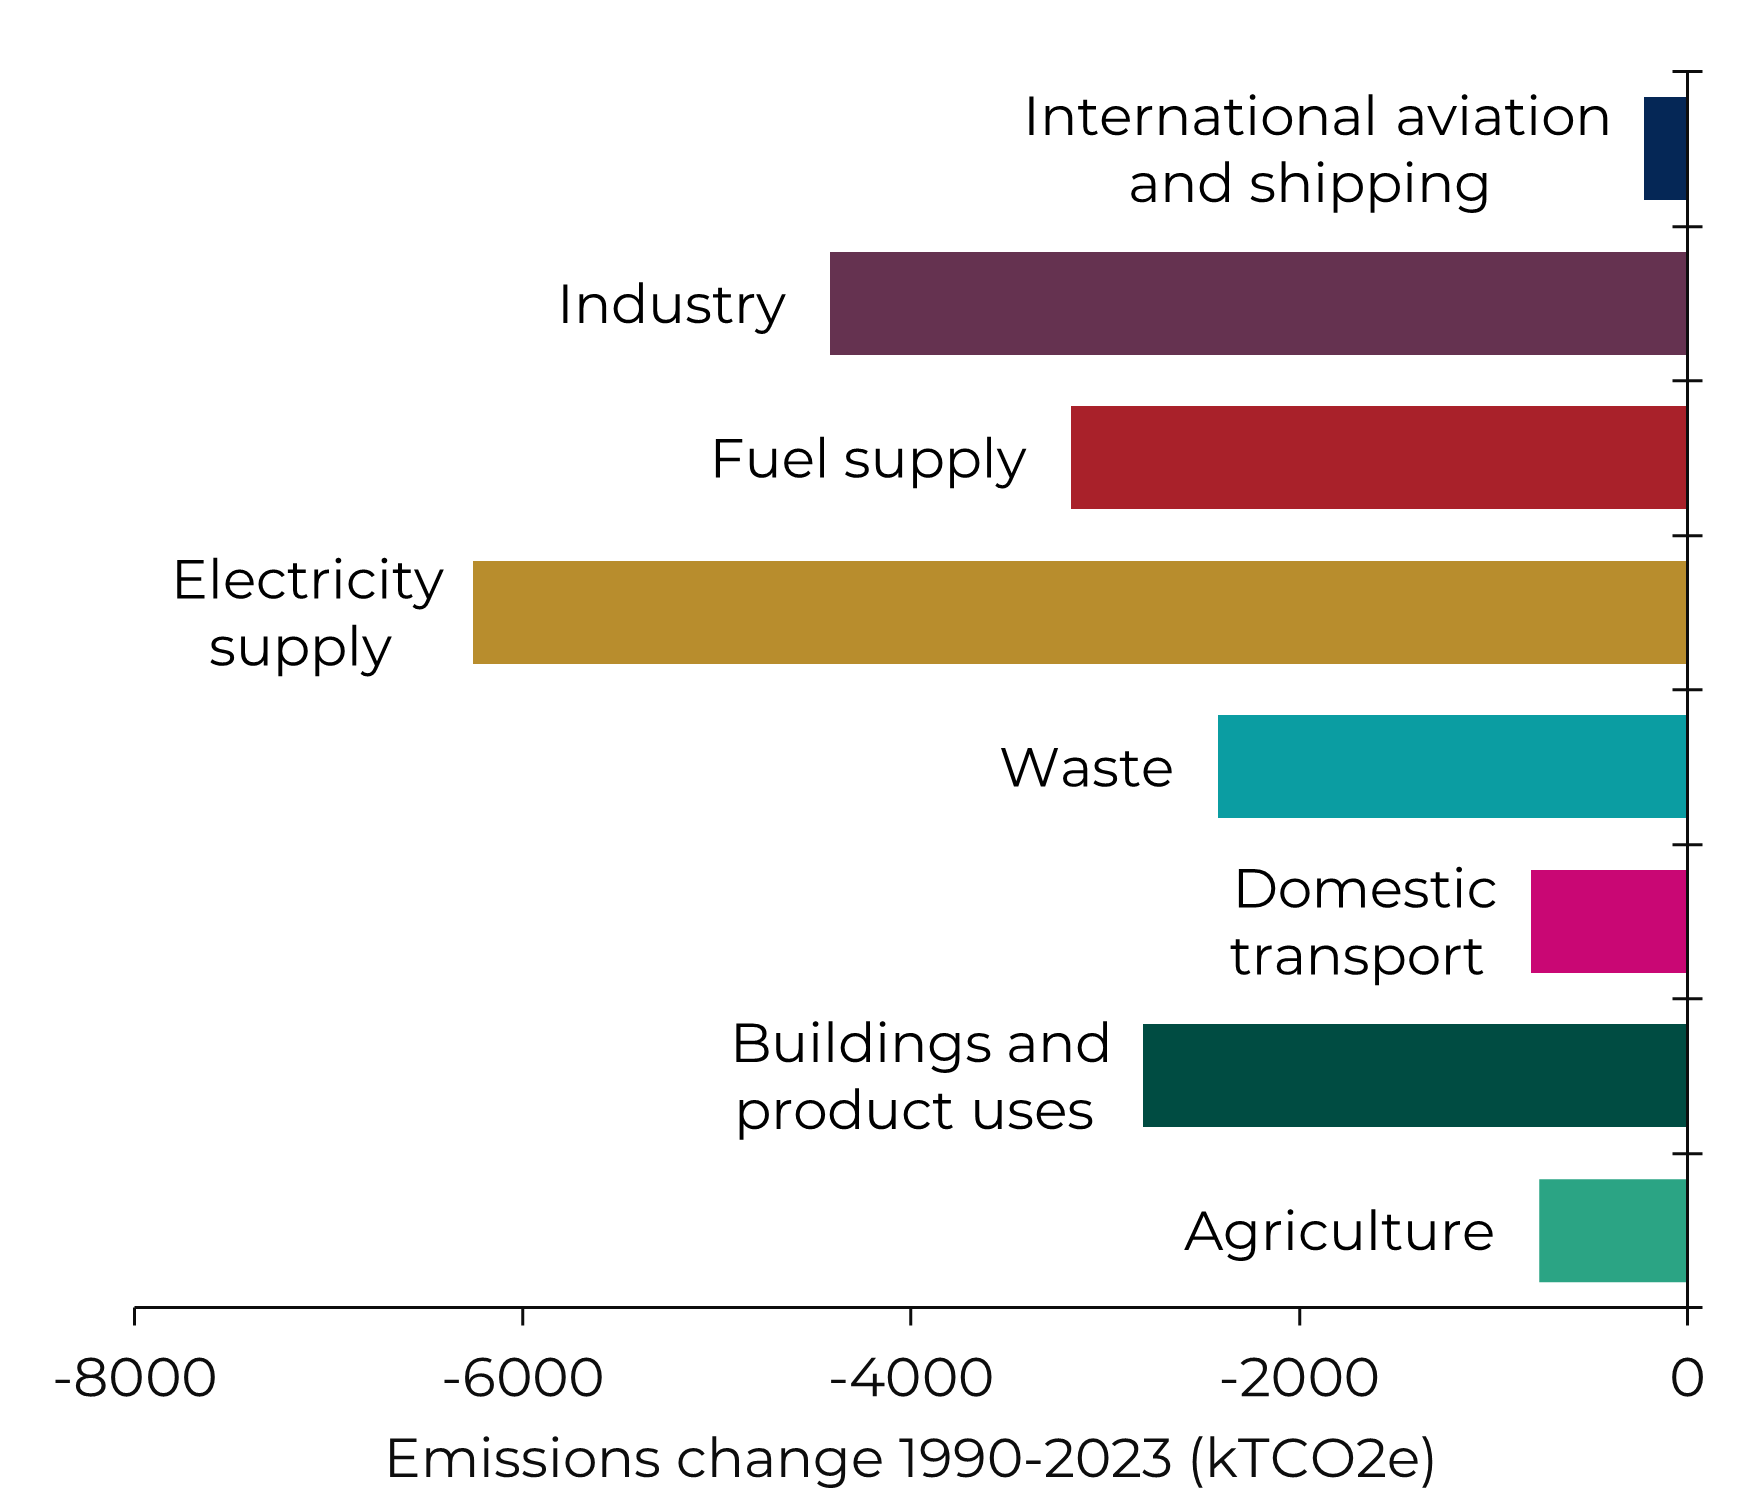
The large fall in reserved emissions has been dominated by electricity supply and industry, which together account for more than half of the total emissions drop against the baseline.
Emissions reductions in reserved and devolved sectors between 1990 and 2023

Source: NAEI
Sector-specific trends
Emissions in every sector have declined relative to the baseline, although the size of this fall varies a lot.
Annual Welsh emissions by sector, 1998 to 2023.

Source: NAEI
Emissions have reduced by more than half in the waste and electricity supply sectors. There have been comparably modest declines in domestic transport and agriculture.
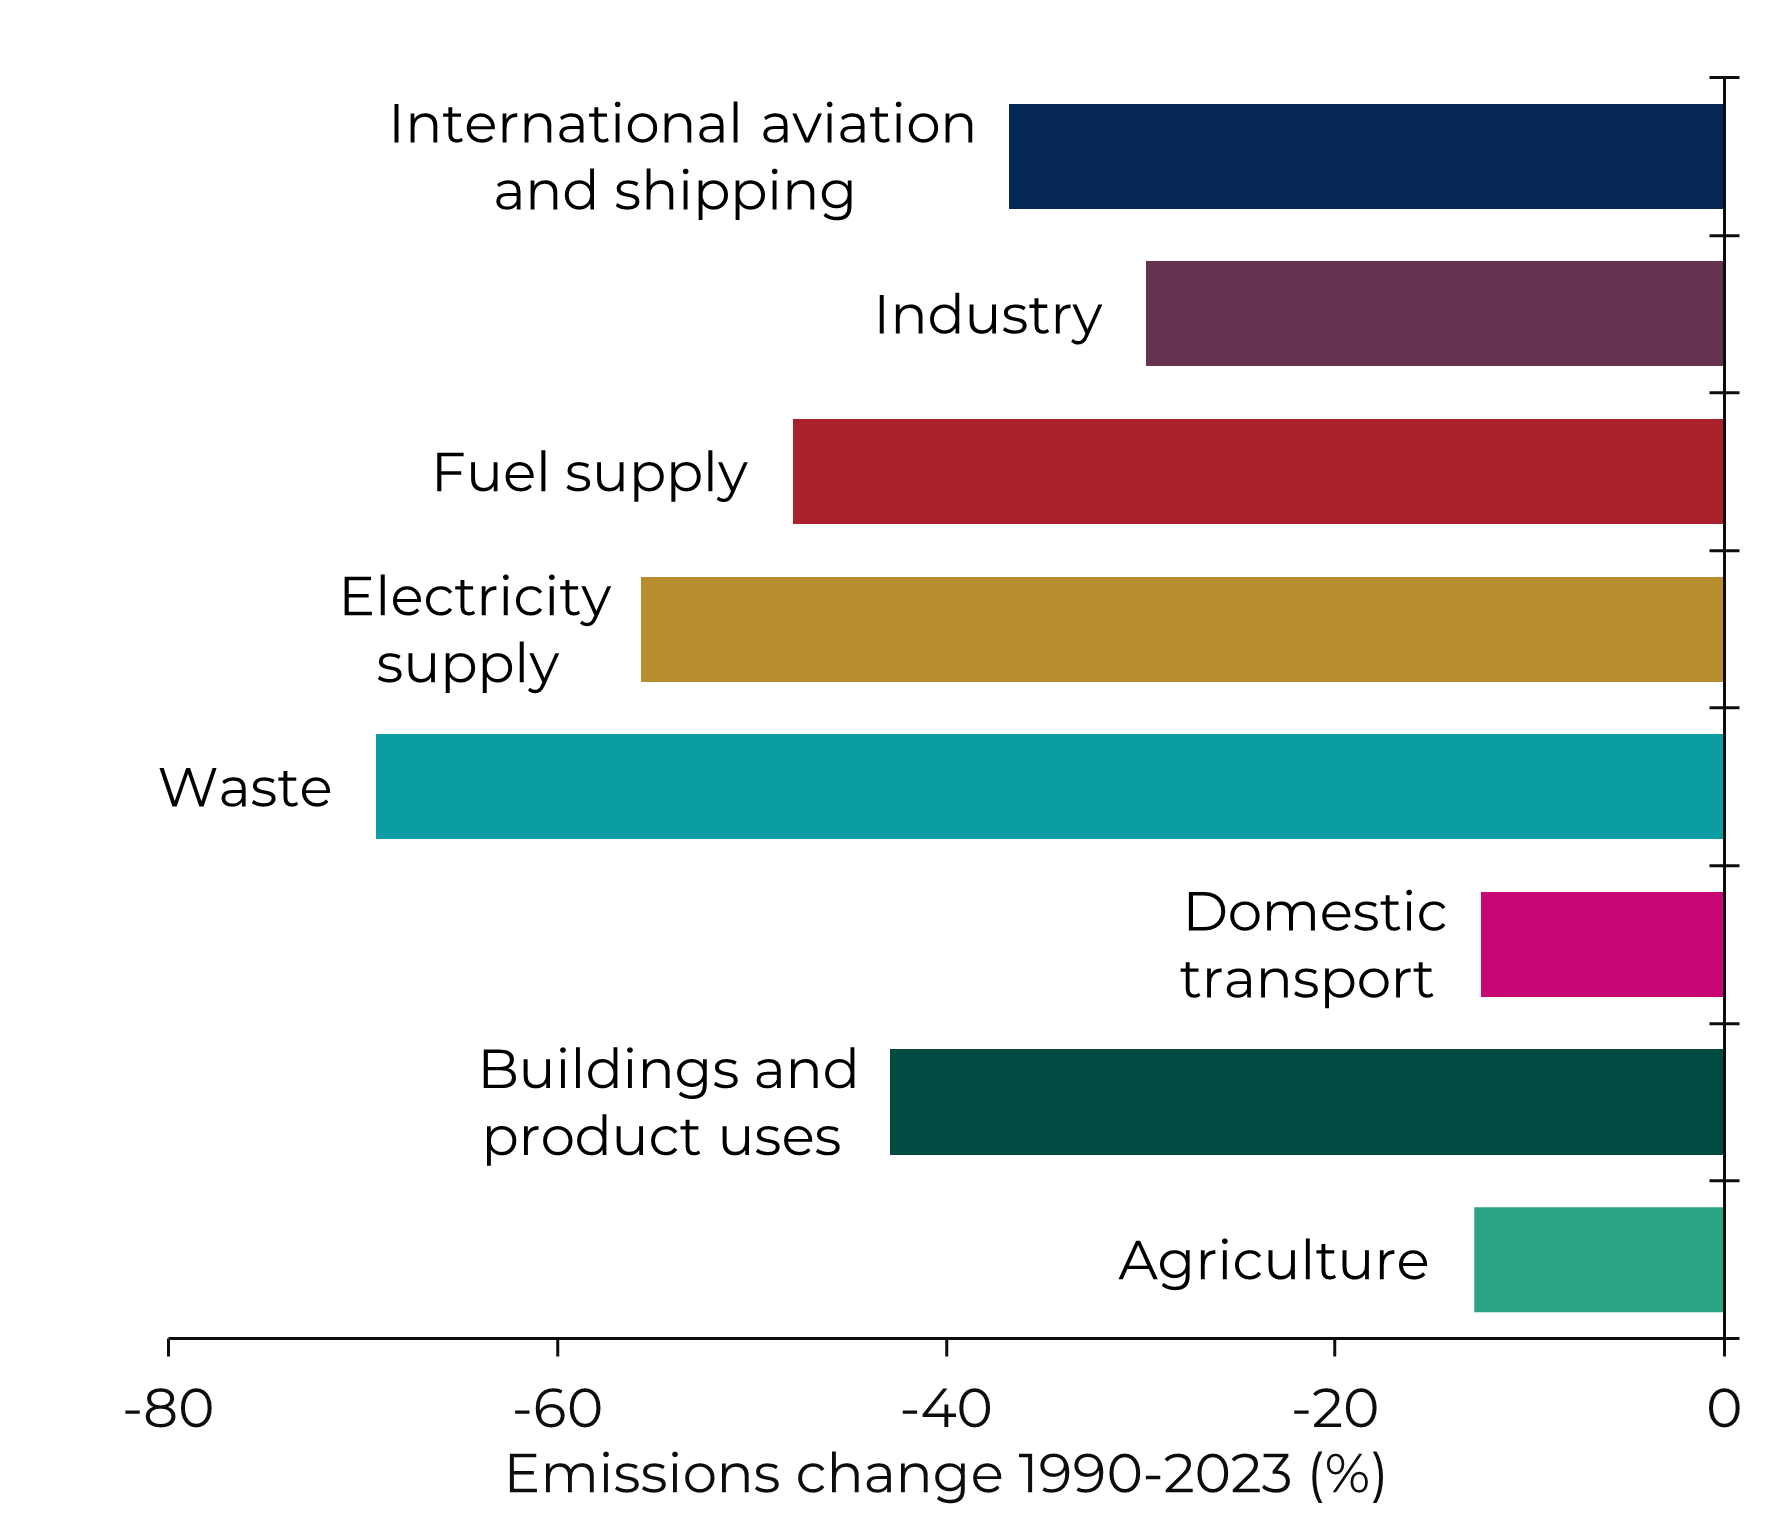
The closure of Wales’ last coal-fired power station in 2020, and major growth in renewables such as wind and solar, accounts for a 69% decline in electricity supply emissions since 2016.
Consumption emissions
Territorial emissions, which are analysed in this article, are relatively easy to measure and they also are the basis for Wales’ statutory emissions reduction targets.
However, territorial emissions do not include emissions ‘embedded’ into imported products and services. For example, if a car was built in Germany and imported to Wales, the emissions associated with its production would count towards Germany’s territorial emissions, but not the Welsh total. Measuring progress by looking solely at territorial emissions risks rewarding the ‘offshoring’ of polluting industries, if the same products and services are still being consumed but are produced elsewhere.
Measuring ‘consumption’ emissions tries to correct this – accounting for both imported emissions, and those produced directly by Welsh households. Consumption emissions can be thought of as domestic production, plus imports, minus exports.
In 2023, the Welsh Government published an estimate of consumption emissions between 2001 and 2020. This report also provides a comprehensive explanation of this metric, with the caveat that there is much greater uncertainty in estimating consumption emissions compared to territorial emissions.
Welsh consumption emissions were estimated to be slightly lower than territorial emissions throughout the whole 2001-2020 period. The Welsh Government attributed this to Wales’ high share of emissions-intensive manufacturing, much of which is exported. Consumption emissions declined by 37% over this period, similar to a 36% reduction in territorial emissions. These figures are impacted by sharp declines in 2020 due to Covid-19 restrictions.
Welsh consumption and territorial emissions, 2001 to 2020

Source: NAEI, Welsh Government
Consumption emissions can be broken down by place of origin: Wales, rest of the UK, or rest of the world. Emissions from consumption of Welsh-made products and services was the smallest component in 2020 (22%). Rest-of-UK sourced emissions contributed 32%, whilst 46% of emissions were embedded in products and services from the rest of the world.
Welsh consumption emissions by source, 2001 to 2020

Source: Welsh Government
Future prospects
The Welsh Government’s Net Zero Wales plan sets out its policies to deliver carbon budget 2 (2021-2025). It will need to publish an equivalent plan for carbon budget 3 (2026-2030) before the end of 2026.
The closure of Port Talbot’s last blast furnace in 2024, ahead of its replacement with an electric arc furnace, is predicted to have lowered Wales’ industrial emissions by more than 50%, according to the CCC. Expected growth in renewable energy, including floating offshore wind, will likely also lower emissions in the reserved electricity supply sector.
The CCC’s recent advice says that future decarbonisation will become increasingly dependent on policy action in devolved sectors, such as agriculture, land use, and surface transport. The Welsh Government is therefore likely to bear a growing responsibility for limiting Wales’ contribution to climate change.
Territorial emissions data for 2024 is expected to be published in June 2026.
Article by Dr Matthew Sutton, Senedd Research, Welsh Parliament.