
The term ‘the science’ has been heard a lot during the coronavirus pandemic. This article outlines the two main bodies that provide scientific advice and where you can find some of that advice. It explains what the R number means as well as why some no longer consider this to be the best indicator for monitoring the pandemic in its own and how the R number interacts with the community, hospitals and care homes.
Key terms
- Incubation / pre-symptomatic period = the period between becoming infected with the virus and showing symptoms. For COVID-19 this is 5-6 days on average, but can be as long as 14 days.
- Asymptomatic = showing no symptoms.
- R₀ = the initial reproduction number. The average number of people an infected person transmitted the disease to at the start of the epidemic, before anyone has immunity to it. This has been estimated to be 2.8 for COVID-19 in Wales.
- Rt = the reproduction number at a point in time. The average number of people an infected person transmitted the disease to at some point in the epidemic. As of 10 July, this is predicted to be between 0.7 – 1.0 in Wales with a central estimate of 0.8.
Scientific Advice
Technical Advisory Cell
The Technical Advisory Cell (TAC) is an advisory body of the Welsh Government. It provides “scientific and technical advice to support Welsh Government decision makers during emergencies”. This includes providing regular updates from the Chief Medical Officer (CMO) for Wales to senior Welsh Government officials about emerging outputs from the UK Government’s Scientific Advisory Group for Emergencies (SAGE).
TAC is co-chaired by Dr Rob Orford (Chief Scientific Advisor for Health for Wales) and Fliss Bennee (Deputy Director for Technology, Digital and Innovation for Health and Social Services in the Welsh Government). TAC’s membership is drawn from the Welsh Government, Public Health Wales, Cardiff University and Swansea University, amongst others.
TAC regularly publishes summaries of the advice it provides to the Welsh Government along with more subject specific research, for example on face coverings.
Scientific Advisory Group for Emergencies
Dr Rob Orford says that the “Welsh Government is using information from SAGE - as well as modelling from our own Technical Advisory Cell (TAC) - to make important interventions in our response to Covid-19.”
SAGE is responsible for ensuring “timely and coordinated scientific advice is made available to decision makers to support UK cross-government decisions”. It relies on external science and advice from expert groups including its own sub-groups such as the Scientific Pandemic Influenza Group on Modelling (SPI-M) and the Independent Scientific Pandemic Influenza Group on Behaviours (SPI-B).
SAGE is chaired by the UK Government’s Chief Scientific Adviser, Sir Patrick Vallance and co-chaired by the Chief Medical Officer for England, Professor Chris Whitty. A list of its members has been published but it only includes those who gave permission to be named. Both Dr Rob Orford and Fliss Bennee are listed as members of SAGE.
The reproduction (R) number
The R number is not constant and depends on a number of factors, including human behaviours; size and density of the population; and the infectiousness of the virus at the beginning of the pandemic.
If the R number is below 1, each case will result in fewer than one additional case, so over time the number of cases will reduce to zero. For example, if the R rate was 0.7 then 10 cases would result in 7 additional cases. However, if the R number is above 1 then the number of cases will increase and the higher the R number the faster this will happen.
As of 10 July, it’s estimated that the R number in Wales is 0.8. and has been below 1 for at least seven weeks.
Using the R number
In June TAC first said that “as the number of new cases drops to low levels, R becomes very sensitive to daily changes in cases through testing and tracing”. It noted the “growing uncertainty in estimates of R” and that it was a “now less useful” as an indicator of the epidemic.
In TAC’s summary of advice on 10 July, it said that it “does not have confidence that the R estimate alone is sufficiently robust to inform decisions”. TAC suggested that “other measures such as number of new cases and GP reports will become more important”.
Public Health Wales publishes data daily including the number of new cases of COVID-19 in Wales. This includes tests requested for hospital inpatients, individuals in A&E, care homes and prisons and community testing.
Comparing R numbers
In June 2020 TAC published a report on the comparison of R numbers across Europe. It stated that “many countries in Europe showed a sharp decline in the [COVID-19] infection rate following lockdown”. However, “the UK did not show the same sharp drop in infection rate”. TAC goes as far as saying that:
…it could be concluded that the UK’s lockdown measures were not as successful as those of several other European countries, as evidenced further by the larger number of deaths in the UK than any other European country of comparable population size (France, Germany, Italy).
Graph 1: Germany - Each bar shows the number of new cases per day and the blue ribbon shows the calculated R number.
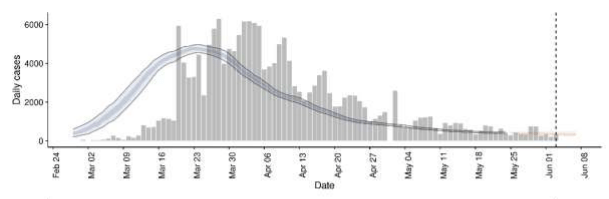 Source: Technical Advisory Cell, Impact of European measures to ease lockdown restrictions on R values summary of advice. (8 June 2020)
Graph 2: Italy - Each bar shows the number of new cases per day and the blue ribbon shows the calculated R number.
 Source: Technical Advisory Cell, Impact of European measures to ease lockdown restrictions on R values summary of advice. (8 June 2020)
Graph 3: UK - Each bar shows the number of new cases per day and the blue ribbon shows the calculated R number.
 Source: Technical Advisory Cell, Impact of European measures to ease lockdown restrictions on R values summary of advice. (8 June 2020)
Our earlier blog post provides an international comparison of the coronavirus restrictions.
Three different epidemics
The first publication from TAC in May said that “we are likely to be seeing three different epidemics for specific groups of the population in Wales” and categorised the following settings:
- Community or the general population in Wales;
- Hospitals and healthcare settings – where there is a high volume of COVID cases in one place and therefore a higher risk of onwards transmission; and
- Care homes – where infection can spread rapidly.
It noted that public health measures introduced (like the coronavirus restrictions) “will reduce R in the community, but not in hospital”. However “hospital infection control will reduce R in the hospital setting without requiring intervention in the community”.
TAC advised later in May that these three settings are “not independent: infection can be spread between hospitals and care homes, from these settings back into the community, and vice versa”.
This was also discussed by SAGE who described “the overall epidemic” as “three separate, but interacting, epidemics”. It stated that “as community incidence decreases, hospitals and care homes account for an increasing proportion of the overall number of cases”.
Impact on the R number
As mentioned previously, the R number becomes very sensitive when the number of news cases are low. These three epidemics also play a role in this as, TAC says, the spread of infection between these settings “cannot be captured through estimating R separately”. It recommends that the situation in each particular setting is monitored “in terms of how the number of case and deaths in them is changing” and where possible find how these three epidemics interact.
Key sources
- Welsh Government’s Technical Advisory Cell (TAC)
- Scientific Advisory Group for Emergencies (SAGE): Coronavirus (COVID-19) response (including SAGE meeting papers)
- Scientific Advisory Group for Emergencies (SAGE): Record of SAGE discussions
- Public Health Wales: Coronavirus homepage
Article by Lucy Morgan, Senedd Research, Welsh Parliament
We’ve published a range of material on the coronavirus pandemic, including a post setting out the help and guidance available for people in Wales and a timeline of Welsh and UK governments’ response.
You can see all our coronavirus-related publications by clicking here. All are updated regularly.